When it comes to technical analysis, two of the most important and most commonly used terms are without a doubt “support” and “resistance”.
These simple, yet effective ideas are fundamental to many trading strategies and often give us key entry and exit points for our trades.
It is common for most new traders to underestimate or even ignore the importance of support and resistance levels when it comes to technical analysis.
Most newbie traders will be tempted to dive straight into more complicated strategies and will focus their attention towards the advanced indicators such as Fibonacci levels and Bollinger bands, for example.
When they do this, they are missing out on some key information in the market that could drastically improve their bottom line and overall trading success, and the bonus is, it’s all pretty easy to understand.
Support
Okay so let’s start with support. As the name suggests, support is a price point in the market that will usually give the market some stability and act as a support structure for the current price.
It is essentially holding/ supporting the price up to where it currently is. In theory, If it falls back down and hits the support it should be more likely to rebound off it and continue back upwards.
Where would I see a support?
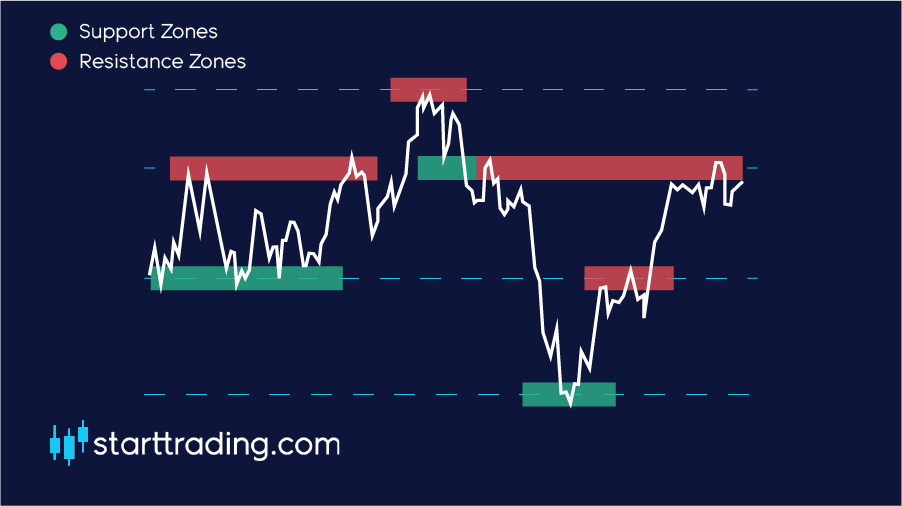
When the price action hits a new low point, or if the price is continually bouncing off of a similar price point when in a downtrend then this will usually be considered support.
This support area normally arises due to an increasing concentration of demand in the market. There are more buyers than there are sellers at the support zone, so naturally, the market is driven back up.
If the market is in a downtrend, it is usually expected for the downtrend to pause and potentially reverse at these support zones.
Note: The more times support/resistances have been tested the stronger it is considered to be.
Resistance
Resistance acts in the exact same way as to support, except that it acts as a ceiling that the price must breakthrough in order to continue its uptrend.
When the price action reaches a resistance point, it is expected to slow down, pause and potentially reverse into a downtrend as the concentration of supply increases and demand reduces.
Where would I see a resistance?
Resistance points are found when the price reaches a new high and then retraces back. This will typically signify a new area of resistance as it failed to break this price point previously.
If the price repeatedly fails at the same point and keeps getting rejected during an uptrend, then we can consider this a resistance too.
Note: Most traders operate on the premise that each support and resistance zone will not be broken and that it will in fact hold.
Breakout
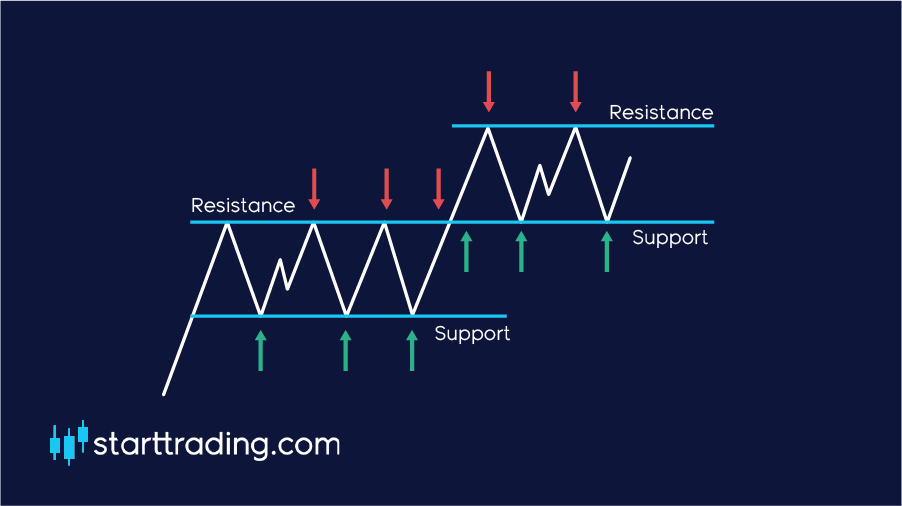
As shown in the above example the price can move through a support or resistance point, this is called a breakout. The price has pushed through the imaginary obstacle, hence the name breakout.
Old floor, new ceiling & old ceiling, new floor
As the market is always moving, so too are the support and resistance zones. When the market makes new lows and highs, these will become the new support and resistance zones.
The old floor becomes the new ceiling (the old support becomes new resistance)
The old ceiling becomes the new floor (the old resistance becomes new support)
Market psychology
Market psychology plays a huge role in the market movements. In a way, indicators and key market levels such as support and resistance only exist because everybody expects them to exist at the same time.
The vast majority of people place their longs at support zones and people place their shorts at resistances. This makes support and resistances somewhat of a self fulfilling prophecy.
Traders watching the market will remember what has happened in the past and will anticipate future movements based on that information. This is definitely something to keep in mind when you are trading the market yourself.
Some other areas that may act as resistance points include round numbers, intersections with moving averages and trend lines. More on this later.