
Archives: Lessons
Ways to analyse the market
When we are trading, we never enter the market blindly. No successful trader has ever made a living out of trading based on gut instinct.
We must analyse the market, the currencies and their countries in order to best predict how the market will behave and where the price will move.
There are two main types of analysis when it comes to trading, these are; fundamental and technical. Let’s break each one down.
What is fundamental analysis?
Fundamental analysts are concerned with the macroeconomic forces that can influence a country and its currency value.
The three main areas that fundamental analysts will look towards are the political, economic and social factors that influence the currency they are looking to trade.
To put things simple, if a country’s economic indicators are looking good, such as low unemployment rates, growing GDP, and low inflation rates, then their currency should strengthen. On the other hand, if these things aren’t looking so good then that could point towards a slightly bleaker future for that currency and it should weaken.
Naturally, fundamental analysis is more commonly used in traders that open long-term trades, such as position trades. Swing traders should also be mindful of the fundamentals as any significant news could heavily impact their open positions.
Here are some of the key areas that fundamental analysts pay close attention to:
- Interest rate changes
- Inflation rate
- GDP
- Retail sales
- CPI (Consumer price index)
- Unemployment rates
- Political stability and key election dates
What is technical analysis?
Technical analysts focus on how historical price movements and previous market behaviours may help to predict where the market will move next.
This is the main type of analysis that scalpers, day traders and swing traders use, and therefore it is the main form of analysis that we will cover in this course.
There are a vast variety number of technical indicators to pick from, each of which uses historical data obtained from the market to try and determine where the market will move next.
History does tend to repeat itself, so using data obtained from this analysis can prove very profitable to those who implement it wisely.
The vast majority of the technical analysis is done by computers and the algorithms that can be found in trading and charting software. The skill is not in obtaining the data, but more in how that data is used.
Here are some of the top trading indicators that are most commonly used in the forex markets:
- Support and resistance
- Price action
- Fibonacci
- Moving averages
- Moving average convergence divergence (MACD)
- Relative strength index (RSI)
- Bollinger band
Technical vs fundamental analysis
It seems that there is always debate over which type of analysis will produce the best trading results. You will often hear technical traders saying that fundamental analysis is unnecessary as all of the information is already factored into the price.
On the other hand, you will get fundamental analysts claiming that none of the technical indicators work and that trading based on technical analysis is futile.
As always, the truth lies somewhere in between.
There are a lot of technical indicators that are not worth their salt, in fact, the majority of them are quite useless.
However, there are some indicators that give extremely valuable information that provides a great insight into the market dynamics and allow us to make high probability trades. We will be covering these key indicators in this course.
Similarly, it is never a bad thing to have an eye on the fundamentals. It definitely pays to be aware of key dates and how each country’s economy is performing and its current political situation.
The more information you have, the better.
For the sake of scalping, day trading, and swing trading, it is recommended to focus upon the technical analysis and supplement that with a solid understanding of the fundamentals.
There is no need to become an expert economist, but a rudimentary knowledge of what is going on with the currencies and their nations will go a long way.
Trading styles
There are three (or possibly four) main trading methods for you to choose from when you are looking to enter a position. These are scalping, day trading, swing trading, and position trading.
For the sake, of course, we will be looking at the first three methods just mentioned. This is because position trading involves holding a position for months and possibly even years – it’s a buy and hold method that doesn’t really qualify as active trading.
With that being said, let’s break down the three individual methods and explain what each one entails.
Scalping
Scalping is a highly active and fast-paced trading style. The idea of scalping is to take 10’s or 100’s of small profits each day, aiming to take advantage of tiny market movements.
Typically, a scalper will be in and out of the market within a few seconds up to a maximum of a few minutes.
It is for this reason that a scalper will predominantly be looking at the charts on very low time frames, such as the 1 minute, 5 minute, and the 15 minute. Some traders even prefer to go lower than that.
To be a successful scalper you must be able to react quickly to market movements and have a high level of discipline. You must know when to take your profit and know when to cut your losses.
One small blip can ruin a whole day of successful scalping, which can be very frustrating. If you can maintain high levels of focus and can concentrate for long periods of time without getting distracted, then scalping may be a good option for you.
Screen time: High
Number of trades per day: 25+
Timeframes: M1, M5, M15
Day trading
As the name suggests, day trading is the opening and closing of trades within the same day. Day traders normally scan the market for a trade, set up a position, enter it, and then close it all on the same day.
You don’t need to have the same laser focus and concentration that a scalper would, however, it does still require discipline.
Typically, day trading is best suited to those of us who don’t like to keep our trading positions open overnight. If you prefer to get a good night’s sleep without worrying about what your trade is doing, then day trading is probably your best bet.
This is the reason why day trading is so popular – you can open your positions, make a profit, close your laptop down, and the job is done.
Screen time: Medium
Number of trades per day: 0-5
Timeframes: M30, H1, H4
Swing trading
Last but not least, we have swing trading. This is very similar to day trading however the positions are kept open overnight and can be held anywhere between two to six days – sometimes even a few weeks.
As this is a more hands-off approach, it is best suited for people who don’t want to be staring at a screen all-day yet don’t mind having open positions.
The markets tend to fluctuate quite a lot, so swing positions may be at a loss for days at a time before finally turning into profit. This requires a certain mental toughness and the discipline to stick with your trade and to trust your own analysis.
This is a very popular form of trading as it does not require a lot of time to manage, however, it does leave traders at risk during the weekends and during market closes, which upon reopening can produce volatile and abrupt market movements.
Screen time: Low
Number of trades per day: 0-3
What timeframes: H1, H4, D1, WK
Brokers
In order to trade on the forex markets you need to have an account with a broker. A simple Google search will bring up hundreds of different brokerages all fighting for your custom, but to be honest it is a bit of a minefield.
It can be confusing and overwhelming for newbie traders to pick a brokerage, but don’t worry, we have gone ahead and picked out one of the best for you.
Our personal brokerage recommendation – NAGA
Why Naga?
Naga is a fantastic broker that offers over 500+ tradable asset classes including, forex, stocks, commodities and even cryptocurrencies.
Of course, we recommend sticking to forex trading but if you do like to trade any other assets then you have the added convenience of keeping it all with the same broker.
On top of that, the platform is extremely friendly to inexperienced and newbie traders. There is no minimum deposit required and they offer a wide range of deposit and withdrawal options, unlike some of their competitors.
They have a top notch customer support team and are fully regulated so you can be sure that your funds are safe.
Here is a list of the key benefits you can expect from signing up with NAGA as your broker.
- Ultra low fees
- No minimum deposit
- Multi-currency accounts
- Great customer support
- NAGA Mastercard
- Regulated by CySEC
- Copy trading (copy top traders positions automatically)
- Educational content to help you with the platform and other basics that you may need help with.
- Fully supported DEMO account available.
How to set it up
The best and easiest way to start trading with NAGA is to download MT4 directly from their website. NAGA will already be connected which means you don’t have to mess around connecting the broker yourself.
Download MT4 directly from NAGA here – https://www.naga.com/register?is_flexible=true&cmp=4u9u7h3a&refid=1086
If you already have MT4 set up then you can register for a NAGA account here:
https://www.naga.com/register?is_flexible=true&cmp=4u9u7h3a&refid=1086
MetaTrader 4
Metatrader 4 is a massively popular trading software that you can download and use for free.
It’s a fantastic tool that forex traders can use to view real time price movements, open and close positions, view and edit charts and graphs, and access all of the technical indicators that we have mentioned throughout this course.
In the past it was solely for the use of forex trading, but now you can trade futures, equities, CFD’s, and more, all using this one platform.
It’s a great one stop shop for everything you need when you trade, so we highly recommend that you download it. It’s extremely user friendly and it offers a massive range of currency pairs – way more than you would ever need access to.
How to set it up
Okay, so let’s run through the steps that you need to take to get started.
Step 1: Download Metrader 4 (MT4.exe) – You can download it from https://www.metatrader4.com/en/download
NOTE: You can download MT4 for PC, iPhone, iPad & Android
Step 2: Open an account with MT4. Here you can decide if you want to use a live account or a demo account. If this is your first time trading then it is recommended that you start with a demo account to get to grips with things before going live.
Registering with MT4 will require that you upload some identification documents, so make sure you have those to hand.
Make a note of your account details, username and password for future reference,
Step 3: Now you need to link your broker account to MetaTrader 4. To do this, simply log in to your brokerage account from the MT4 interface.
NOTE: For those of you that don’t have a broker yet then check out or next section for our personal recommendation and how to get set up.
How to open a trade
Alright, now that we have our account set up with MT4 and our broker is linked to the software we need to learn how to open a trade.
Firstly, select the currency pair of your choice by clicking on the “Window” tab that you can find at the top of the interface.
Select the currency pair by clicking on the ‘Window’ tab at the top of the MT4 platform, and then select ‘New Window’. All of the main currency pairs that you should be trading are there.
You can then click ‘New Order’ on the MT4 toolbar or press F9 to open an ‘Order’ window.
The screenshot below displays the ‘Order’ window for the EUR/USD currency pair. From here it is a relatively straightforward process. Simply enter the trade size that you wish to open your position with and then choose either “Buy by Market” or “Sell by Market”.
Doing this type of order will automatically fill the order based on the current market price. While it’s okay to do this sometimes, it’s far better to enter a “limit” trade and choose your entry spot carefully with the technical analysis that you conducted.
To do this, open the drop down list by clicking on “type” and select “pending order”. Here you can set up a buy or a sell at specific price points in the market.
Set take profit & stop loss order
When you place your order you will be presented with the option to enter the price point for your take profit and stop loss orders. It is very important that you know these areas before you trade.
If you have followed our course properly then you will know the importance of discipline and trading consistently using the correct RRR. This is the point where the theory turns into practice.
Every time you open a position, make sure you have at least a stop-loss order placed at the same time. This will ensure that your trading account is safe from any flash crashes or big market swings while you are in your position.
You can enter your take profit and stop loss orders manually into the field or you can use the arrows to automatically populate it with the current market prices.
Economic Indicators
When you’re out there conducting your fundamental analysis and researching the latest developments on the markets you are going to come across a lot of economic indicators. GDP, CPI, employment rates, etc, etc.
It’s all well and good finding this information, but what does it really mean and how does it impact the value of a currency?
In this section, we will break down the main economic indicators that you will come across and discuss what each of them signifies and how the markets will typically react to them.
Gross Domestic Product GDP
Let’s start with one of the big ones, GDP. Unless you have been hiding under a rock or you have never watched a news channel before, you will most likely have heard of GDP before.
Gross Domestic Product is the widest measure of the overall health of an economy. It is a way to measure the market value of a country’s goods and services. Because of this, it is used to determine how well or how poorly the country is performing economically.
It’s such an important indicator that this is what economists use to determine what stage of the business cycle we are currently in. If we see two consecutive months of negative GDP, this is what we call a recession. As soon as we enter a positive month the depression is considered to be over.
This is a good indication of the current sentiment around a currency. If the country’s economy is in a recession then there will be a higher likelihood that the value of that currency will fall. Something to keep in mind.
Note: It takes a long time to compile the data that goes into the GDP calculations. By the time the data is released most of the information is already known, so usually, it has little to no impact on the market. However, if the GDP figure is far from what is expected then it can certainly cause chaos in the market.
Non-farm payroll
Non-farm payroll, or NFP, is a key economic indicator for the United States economy. As the USD is by far the most traded currency in the world, chances are you will be trading using it at some point in the future.
NFP is intended to signify the total number of paid workers in the U.S. excluding farm employees, government employees, private household employees and employees of nonprofit organizations.
It is one of the most significant economic indicators for the U.S. economy and the fluctuations in the market prove that.
It is normally released on the first Friday of every month at 8:30 am EST. You will definitely want to keep an eye on that date. Even in the days before the figure is released the market becomes particularly volatile in anticipation of the release as there are thousands of traders trying to second guess the market.
There will be a general expectation as to what the figure will be, but of course, this expectation is not always correct.
The higher the payroll number the better for the U.S. economy. This is definitely one to keep an eye out for, but be warned, the markets can get extremely volatile in these moments.
Consumer Price Index
The consumer price index, or CPI, measures the costs of goods and services by calculating the average price of a specific basket of goods or a service.
When the CPI changes this is a reflection of the rate of inflation which is a very important figure when it comes to currency trading.
It gives us an objective view of how quickly prices are rising or falling in the economy. This number is also released monthly in the United States and in the UK, so you need to keep an eye on these dates.
This metric is used to determine if the economy is on track with the projected inflation rates. If they are then this is good for the economy and will usually attract investment, if not then the currency may weaken.
Employment Indicators
Employment is one of the key indicators that signify the strength of a country’s economy and how well the government’s policies are performing.
There are a number of indicators you can follow to get employment statistics, one of the most significant is the NFP.
There is an Employment Monthly Report that is released once a month that displays the employment rate and the unemployment rate (given as a percentage of the total labour force).
The lower the unemployment rate the better it is for the country’s economy.
Interest Rates & Central Bank meeting
Any change in the interest rates is typically met with a huge reaction in the forex markets. These rate changes affect everybody and everything surrounding the currency; the buyers, sellers, importers and exporters.
The Central Bank of a lot of the major forex currencies has regular meetups each month to discuss the current state of the economy. Sometimes the bak can make drastic decisions such as altering exchange rates or implementing quantitative easing strategies.
These are huge events in the forex world and the markets will usually wait in anticipation during each of these regular meetings. Unless you have some key insider information, it’s best to be cautious and avoid trading around these periods.
Retail Sales
Retail sales measure exactly how much consumers are spending in stores that sell goods. It counts all the receipts from our high street spending, grocery store visits, DIY trips, you name it.
This gives a great insight into how consumers are behaving and essentially how the economy is performing. If consumers stop spending money, the economy will stop working. Money makes the world go around, after all.
Retail sales figures are crucial indicators to the strength of the economy because if the consumers are spending, it means the profits of companies will be up and share prices will follow. This will attract investment and usually gives a boost to the country’s currency.
Fundamental analysis
As we mentioned previously, fundamental analysis is an approach to analysing the market by looking into the social, economic, and political issues that may affect a country and its currency.
These are all vital components that drastically influence the supply and demand of the currency, so it is worth keeping an eye on them for the periods that you’re trading.
Fundamental analysis vs technical analysis
The main style of analysis that we have covered in this course has been technical. This is the use of indicators, oscillators, as well as the analysis of price action and candlestick reading.
While this is great for short/medium term trading, fundamental factors will always have the biggest effect on the markets.
Truth be told, most traders ignore the fundamentals of the currencies that they are trading. The general argument is that they do not need to concern themselves with macroeconomics while they are trading the smaller time frames.
While there is certainly some logic to this, it is a flawed and naive outlook. The more knowledge we have and the better understanding we have of the markets, the better.
Fundamental analysis can help us to identify potentially turbulent times in the market, shifts in sentiment, and times of great uncertainty – all of which are situations we would be better off watching from the sidelines.
Trading using technical analysis alone is kind of like trading with one eye open. Eventually, you will miss something and run into an unpleasant surprise.
After all, the support and resistance lines you draw on your chart are no match for a central bank adjusting its interest rate or a shock referendum result (ahem, Brexit).
Economic calendar
So how do you keep up with all of these events? Well, the good news is that you don’t need to be an Oxford certified economist. After all, this is “fundamental analysis” not expert, in-depth analysis.
You can simply follow an economic calendar to keep an eye on all of the key dates and important events that happen in the forex world.
An economic calendar is one of the most important tools for traders who wish to keep an eye of the market fundamentals. It essentially lists all of the major economic events that occur across the globe in one easy to read format.
Rather than trolling through all of the news sources yourself and creating your own diary, you can simply take a look at an economic calendar and see all of the important upcoming events for the currency pair you’re trading.
Some of the things that a good economic calendar will list are:
- Interest rate changes
- Central bank announcements
- Political elections
- Economic indicators (GDP, CPI, employment rates etc.)
- Company quarterly earnings reports
- Key speech dates
This is a massive time saver. It brings together all of the information you need in one place. With some economic calendars, you can even filter the results to display the exact event you are looking for. Very handy.
Tip: Even with the use of an economic calendar it is still better to stick to one or two currency pairs when you first start out. It’s easy to get overwhelmed and fall into a state of analysis paralysis. Save yourself the hassle and knuckle down on one pair and become a master of that before you move on.
News sources
If you really want to get your teeth stuck into the fundamental analysis by keeping your ear to the ground on the latest of the forex markets then you will need to find a good news source.
Market news and data are available through many sources, you won’t be hard-pressed to find the information. If you prefer to use the TV to get your news then you will likely find some around the clock coverage on the markets.
Other than that, the internet is your best bet. Stick to the larger and more reputable sources for the most reliable information. Here are some examples of good sources for forex news.
- Bloomberg
- Reuters
- The Wall Street Journal
- UK Investing
Risk vs reward
What is risk vs reward ratio?
If you have spent some time trading before or if you have studied other traders then you will likely have come across the term “risk reward ratio”. This is a crucial aspect of trading that we must understand if we are to become profitable in the long run.
The risk reward ratio is simply the amount of capital that we are risking for the potential gain that we are targeting.
How to calculate R-R-R
Whenever we want to enter a trade we should calculate our risk/reward ratio first. All we need to have is our entry price, stop loss price, and our target price.
Example one
For the sake of simplicity, let’s use round numbers to explain how this works.
Let’s say we are going long on a currency with an entry price of $100.
Image
First we need to ask, how much would we lose if we lost our trade:
Image
Next, how much would we profit if our trade won? From this we can work out what our risk/reward ratio is 60/20 = 3:1. In this example our reward is three times the size of the risk.
Now let’s use an example using pips. Let’s say we are entering a scalping position trying to make a 10 pip gain and we set our stop loss at five pips.
In this case we stand to lose five pips if our trade loses and we win 10 pips if our trade wins.
10/5 = 2:1
In this example, our risk to reward ratio for the scalp would be 2:1.
Easy enough, right? But what does this mean and how can it help with our trading?
Why is risk vs reward important?
When we know what risk reward ratio we will be trading with we can easily find out what winning percentage we need in order to be profitable traders. This is very handy to know as you can always stop and take stock of how you are performing and just how far away you are from becoming a winning trader.
Let’s take a look at what we would need to do to break even if we trade at some different risk to reward ratio.
Image
The problem with too high a RRR
As you can see, the required winning rate drastically reduces as we increase our risk to reward ratio.
Sometimes when newbie traders see this, their eyes light up with the sight of the low winning rates, and they think that it would be easy to attain these levels and instantly become a winning trader. While there is some logic to be found in this, there are a few drawbacks that we need to consider.
Firstly, the higher we go with the RRR, the longer our trades will last, and the more exposure we have to the market. As we have mentioned many times throughout this unit, trading is mostly a mental game.
The longer we expose ourselves to the market, and the longer we have open positions, then the more chance there is that our emotions will get the better of us and interfere without trading.
Secondly, if we have a long RRR, we will get stopped out more often than not, and we will have to overcome dealing with many consecutive losses, which can be a tough burden for even the most seasoned of traders.
Lastly, traders will often cut their trades short when they are in these types of trades and will take their profit early. While at first, this may seem like a bad idea, but what they are actually doing is dooming themselves to being massively unprofitable.
Image
If they cut their winning trades short every time, they will not be reaching that four, five, or six times target that they were aiming for.
That means that they will not be making up for all of those small losses that they have racked up, and they will often never reach the high targets that they set.
Note: It is entirely possible to be a winning trader using high risk to reward ratios, but it is much more difficult. For newbie traders, it is recommended to stick to a lower ratio while starting out until you can find your sweet spot.
What RRR should I use?
It all depends on what type of trader you want to be, however, most traders seem to agree that somewhere around the 3:1 RRR is somewhat of a sweet spot.
When selecting a 3:1 RRR, you will still hit a large portion of your trades without getting continually stopped out and left feeling demoralised.
A 25% win rate using this RRR is definitely achievable using the strategies that we have already brought you in this course, you just need to stick to your trading plan and ensure you trade with discipline every time.
One of the main dangers comes with cutting your winning trades short, so be aware of moving your stop loss to a breakeven position when you don’t need to.
Constantly manage your trade for signs that your initial theory has now become invalid. If it has, it is perfectly fine to exit.
Final word on RRR’s
At the end of the day, the risk to reward ratios are not set in stone. You should chop and change them to fit in with your trading plan and set your targets based upon key levels that you identify in the market.
If you want to set a trade up with a RRR of 3:1 but you see that there is a significant resistance level where 2:1 RRR would be then it would certainly make sense to adjust your trade to avoid that.
The risk to reward ratios should be used as a tool to guide us with our targets and help us trade, not to hinder us from applying solid trading fundamentals to each trade.
Risk management basics
Forex is all about having a plan and sticking to it. As soon as veer away from the plan you are unnecessarily exposing yourself to the market in ways that you didn’t prepare for.
Whether that be trading with more money that you are prepared to lose, or using a different strategy than you have practiced and planned to stick to, straying from your plan can be costly.
That said, let’s look at some key areas of risk management for you to follow when trading the markets.
Position size
You need to work out exactly what percentage of your trading balance you are willing to risk on each trade, once you have that information you can decide what size of lot you are going to buy and how many of them you will purchase.
Most professional traders risk 1% or less of their account every time they enter a trade.
So if you have a $10,000 account then you should be risking no more than $100.
You should keep this number consistent at all times. Do not risk 4% on one trade, 1% on the next and then 3% after that.
Choose your account risk and then stick to that at all times. Consistency is key.
Setting stop losses/ pip risk
Now that we know how much we are willing to lose on our trade we need to calculate where to set our stop loss.
We will go into much more detail on stop losses in the next section, but for now just remember that the stop loss should be set at a predetermined distance from our entry point that signifies our maximum amount of risk per trade.
To do this, we must calculate how much one pip movement is worth to our account and then set our stop loss accordingly.
For example, if one pip is worth $1 to us and we have a $10,000 dollar account then the maximum we can afford to lose using a 1% risk is 100 pips.
Taking profit
This is secretly one of the hardest parts of trading, where to exit when we are in profit. We must use ur indicators and trade research to determine key points to exit our trades.
We should always enter a trade with a key idea of where our entry and exit points are, both stop-losses and profit taking areas.
Again, we will go over this in detail in a few sections time.
Keeping disciplined
As we have mentioned many times over this course, consistency and discipline is vital. Follow your trading plan, stick to your risk management strategy with effective position sizes and always place appropriate entry and exit points.
Why is it important
Having a solid risk management strategy that you adhere to is probably one of the most important aspects of successful trading.
Making a mistake with a trading indicator, placing a support or resistance incorrectly, or even hitting short instead of long are all redeemable errors. We are human, we all make mistakes. However, if we don’t stick to our risk management strategies, these small mistakes can wipe out our entire trading balance. This is exactly what we are trying to avoid.
Good things come to those who wait. Trade patiently, diligently, and with discipline and you will be half of the way there.
Note: If you stick to these tips and practice proper risk management you will likely never put yourself in a position of wiping out your account.
Take-profit
What is a take-profit?
Taking profit is essentially what we want to be doing each and every trade we take. A take profit is the place where we set our exit trade to get out of the market for a profit.
Similar to a stop loss, we should set our take profit trade at a predetermined place and not just a random point.
Newbie traders often make the mistake at aiming for a certain price level or a predetermined percentage gain.
These are just arbitrary levels and are not based on any sort of technical analysis and will almost certainly mean that you’re leaving money on the table.
Why is it important?
Taking profit is arguably one of the most emotionally and technically challenging aspects of forex trading.
People often struggle with taking profits early and seeing their trade run away on a huge move that they have now missed out on. This can really test even the best trader’s mental strength.
Mastering the art of taking profits is crucial for successful forex trading. If we get out too soon we could see our trade run away and we have missed out on profits.
On the other hand, if we don’t set appropriate take profit levels we could see our winning trades become losing trades if we have unrealistic targets.
Where to set our take profit trades?
There are many methods that we can use to take our take profit levels, here are a few of the most common:
- The key support and resistance levels
- MACD crossovers
- RSI overbought/oversold levels
- RSI divergences
- Use your predetermined risk rewards ratio (more on this in the next section)
Look for critical levels in the market that could prove as obvious obstacles. If you are in a long position, it probably wouldn’t be a good idea to set your sell order above a significant resistance point.
Every trade you take will present a delicate balancing act between being over cautious and being too greedy. To eliminate this, set your targets at key levels in the market that take out the subjectivity in your trades.
Multiple take profit zones
Some traders find it beneficial to spread out there take profit orders over two or more areas in order to take their profit incrementally.
This can really help with the mental side of trading as once you have reached your first TP (take profit) level your trade will remain in profit even if it dips below your initial entry point.
Image
This is usually more common in swing trades that are targeting larg pip movements over one to a couple of days. If you plan to do this then it makes sense to set the TP orders at or just before key levels in the market.
In the next section, we will look at risk-reward ratios that will help you to set better targets for your take profit orders.
When & when not to trade
Most of the information you will find when you begin your trading journey will be on how to best spot market opportunities and identify signals when they present themselves.
While, of course, that is extremely useful information, it could be argued that it is equally important to know when NOT to trade and to avoid the market all together.
Whether it be for a personal reason or due to macroeconomic events out of your control, there are certainly moments where you would be better waiting on the sidelines to trade another day.
Personal reasons to avoid trading
First of all let’s look at some times when you shouldn’t trade due to personal reasons. Some of these may seem obvious but you would be surprised how many people ignore these warning signs and blow away their entire trading capital.
Trading when highly stressed/ tired
If you are stressed/tired then you will not be performing at your best and your decision making will be sub par. It’s far better to take a rest and come back when you are feeling fresh again.
If you must do something to do with trading then it would be far better to use this time to study or to paper trade rather than using live funds.
During emotional times
Trading is no different to any other job that you may have in the real world. If you have some serious family issues or if you are under a lot of mental pressure then it would be better to take some time off.
If you ever feel like your emotions are getting the better of you then save the trading for another day.
Trading when surrounded by too many distractions
It’s essential that you are 100% focused when you are trading. You should always be monitoring your positions for how your trades are performing and how the market behaves. It’s hard to learn from the market if you are constantly distracted.
Trading after a heavy loss or during a continued losing streak
After a big loss there is no way you can trade with a clear head. Step away from the computer and come back another day when you have refocused and recovered from the loss.
It would be even better to analyse the trade to see what you did wrong so that you can avoid making a similar mistake in the future.
When you are at work
This ties in with a few of the aforementioned points. If you are at work you likely will not be able to focus and you will be distracted on multiple fronts. Also, we don’t want you to lose your job just yet! Wait until you’re bringing in the big bucks first.
Fundamental and technical reasons to avoid trading
The market reasons for not taking a trade are situations that are way out of your control. Certain events have the potential to send shockwaves through the market, causing huge swings and periods of volatility.
Here are a few examples of such events. During these times, it’s almost always better so sit out and watch from the sidelines.
Large news events
News often plays a big role in the price fluctuations in the market. Some currencies are heavily tied to commodities while others will move depending on how their stock markets perform or sometimes even individual companies.
Keep one eye on the news and make sure you understand what impacts the currencies that you are trading.
Political elections results
This is one goes without saying. Keep an eye on key election dates as the price can fluctuate wildly based on election results.
High profile speeches and budget releases
High profile speeches and budget releases can affect the market considerably. Be aware of when they take place and wait for them to pass by so you can avoid the market uncertainty and resulting speculation.
Bank holidays
A large portion of the trading volume comes from the banks. When they are closed during the bank holiday it means the markets are far less liquid than usual. This can cause market stagnation and occasionally erratic price movements.
Market open/ close
It’s a good idea to try and avoid the market/open close as it can often bring increased volatility. Traders are frantically trying to open/close their positions which can cause erratic price movements.
A word on overtrading
As the markets are open 24 hours a day, five days a week, there are a huge number of opportunities for traders to take advantage of. This is both a blessing and a curse.
Overtrading is one of the major reasons why traders lose money. You should not be entering a position at every signal that you see. As the old saying goes, “good things come to those who wait.”
It pays to wait for clear cut setups where a number of your indicators are all pointing in the same direction. Stick to your trading plan religiously, don’t chase your losses, and keep your trading decisions as objective as possible.
Setting goals
Setting goals
Stop-loss
We have mentioned stop-losses many times in this course so far, and for good reason, we need them! Time to dive a little deeper into the specifics.
As you know, the forex market can be volatile and difficult to predict at times. Even the best traders get it wrong and find that the market moves in the exact opposite direction to what they predicted.
Even if all our indicators are pointing in one direction it is still entirely possible that the market can move violently in the other. A major economic event, a new banking policy, and even strong rumours can affect the price out of nowhere, we must be prepared for this.
A lot of newbie traders will make the mistake of riding the trade it and hoping (praying) that the market will turn back in their favour. Others will cut their loss immediately as soon as they see it turn red and unfortunately, both of these strategies are incorrect.
What we need is a stop-loss. Simply put, a stop loss is an order that we place into the market that automatically executes when the price hits a certain level. It removes all the stress and anxiety from trading without a stop loss and acting the market run away with our entire trading balance at risk.
Sometimes it’s best to cut your losses and live to fight another day.
Where to place our stop loss
As we touched upon earlier, we can calculate precisely how many pips we are willing to lose for each trade.
If we know that we only want to risk 1% of our account, we should calculate how many pips that equate to, and then we know the maximum point at which we can place our stop loss. However, this is NOT the best strategy. We should always set our stop-loss at the point of invalidation.
This means that we should place our stop loss at the point where the reasons why we entered our trade are no longer valid.
For example, let’s say that we expect the price to bounce off a support and reverse into an uptrend. Rather than setting our stop loss at 100 pips below the support, we could set it at maybe 10-15 pips below the support.
That way, we know that our initial trade theory has been proven to be wrong (the support did not hold), and we can exit for a small 10-15 pip loss.
For the sake of this trade, it would be unnecessary to lose all 100 of our allocated pips based on our risk management strategy.
This is the MAXIMUM you are willing to lose on a trade, not how much you should lose each time.
Trailing stop-loss
Other than a setting a regular set stop-loss we can also utilize what is called a trailing stop loss.
A trailing stop loss will move based on fluctuations that occur during the trade.
For example, if you set a BUY order on EUR/USD at 1.1000 with a 50 pip trailing stop at and the market moved up to 1.1050 then the trailing stop would move up to 1.1000.
Every-time the trade moves in your favour the trailing stop loss will trail behind by 50 pips. This is a great way to lock in profits and attempt to ride successful trades out for as long as possible.
The stop loss will only trigger once the market has moved against you by 50 pips.
Image
Moving your stop-loss to your entry position
One thing that traders like to do is to move their stop loss to the point of entry when a trade goes in the favour. This can be a great tactic as it essentially removes all risk from the trade and it effectively a “free shot” at making extra profits.
While this can often be a good idea and can real help remove the stress from a trade it can also mean that you turn some winning trades into break even ones
Sometimes the market can fluctuate violently and it can take out your stop loss before carrying back on its trajectory.
If this happens you can see your trade closing before you get to your profit taking zone and you have just missed out on a winning trade.
While it’s okay to do this sometimes, it’s almost always better to set your stop loss at the point of invalidation.
Creating a trading plan
First things first, we need to create a trading plan. As the old saying goes, “fail to prepare, prepare to fail.”
If we just hit the markets any time we like without giving much thought to what our plan is and why we are doing what we are doing, then you can guarantee that you will be recording losses before you know it.
Granted, you may get lucky for the first few times, but eventually, that luck will run out, and the lack of planning and a clear strategy will undoubtedly show.
A trading plan, not a trading strategy
When we say trading plan we don’t mean that you need a clear idea of where you will enter and exit a trade, instead we mean you need to have an overall sense of what your goals and ambitions are for trading and what sort of funds and time you can allocate towards these goals.
The trading plan should be personal to you, honest, and realistic. This is what is going to help you decide, what, when, and how much you want to trade.
This should be the foundation of your trading and should be referred back to when you feel yourself getting into a rut, or even to stop yourself getting carried away when you’re on a winning streak.
A solid trading plan should help you to keep a logical trading mind and keep your emotions in check by helping you to make more objective decisions and fostering a trading discipline which is so vital to becoming a profitable trader.
How to make a trading plan
Here is a template to follow when making your plan, be sure to include all of these elements and anything else you feel is important.
1. Write down your main motivation for wanting to trade
As with anything in life, it never hurts to stop and take stock of what we are doing and why it is we are doing it.
Why do you want to start trading? Do you want to become a full-time trader, add a little extra income to your full-time job, or do you want to become a fully-fledged expert, and find a job on Wall Street?
Whatever it is, write it down and keep this in mind when you are trading. It helps to keep things in perspective later down the line.
2. How much time can you commit to your new trading career?
How much time are you willing to commit to this new hobby/career? Are you a stay at home parent who can commit 40 hours per week or do you run five jobs and have only a few hours spare? Can you trade during work hours, or not?
If you only have a limited amount of time you need to plan efficiently and make sure you are fully concentrated when doing so. Set aside some dedicated trading time and stick to it, no more, no less.
3. Clearly outline your goals and what you want to achieve
Similar to the first point, but this time you should write down exactly what you want. Use numbers!
For example, “I want to increase my trading balance by 20% within the first 12 months”. That way you can hold yourself accountable and refer back to your goal when you need to.
4. How much capital can you raise for trading?
This is important. Never risk what you cannot afford to lose. Seriously.
This gets said a lot but it is one of the most important factors in trading. If you are overinvested that you will not be trading efficiency, it is simply impossible.
Losses will be harder to take and you will likely be trading with scared money which could lead you to setting stop-losses too tight and taking profits too soon. Keep it realistic.
5. Risk tolerance
We will go into this in more detail later on in the unit, but for now, right down how much you are willing to lose on one trade. The smaller the better of course. Somewhere around 1-2% per trade is reasonable.
It also makes sense to have a daily loss limit. If you lose 2% of your trading balance then call off the trading for the day. If you don’t you will likely chase your losses and trade poorly.
6. Pick a currency pair and a time frame
Don’t be the jack of all trades and the master of none!
It can be very overwhelming to have 30 markets up on your screen with indicators all over the place.
Save yourself the stress and stick to one currency pair and one time frame. That way you can quickly learn how that market behaves and how you can best exploit it.
When you get more comfortable you can branch out when you are ready.
7. Create a trading diary
Last but most certainly not least, create a trading diary. Keep track of everything. There are alot of great tools that you can use online to help you keep account of your trades.
Some of the most important things to write down are the reasons for entering a trade (hopefully there is more than one), how the trade performed, and a post-trade analysis.
By doing this we keep ourselves accountable for every trade and it highly reduces the risk of erratic and sub-optimal trading.
Be sure to go over your diary regularly. This will help you to highlight any weak points that you need to improve on.
Consistency when you trade
Consistency is absolutely crucial to becoming a winning trader, especially in the long run. So how do we achieve this?
Well, we should be aiming to make our trading as OBJECTIVE as possible. This means we need to take our emotions out of the trading process as much as we can by having a clear trading plan and a set strategy to follow.
This means that a large part of the decision-making process has been removed from the equation, and we can simply focus on scanning the market for good setups, and we can monitor the performance of our trades.
Consistent risk
One of the most vital areas we must maintain consistency in is with our level of risk. If we overexpose ourselves on a trade and end up losing, then we can wipe out a considerable part of our trading capital. This is something we want to avoid.
Calculate how much of your trading balance you are willing to risk on each trade. As we have suggested, this should be somewhere close to the1% mark.
Once you have this figured out, it is best advised to trade with consistent lot sizes so that you can keep your market exposure at the same level each time you trade.
This way, you will become more comfortable with trading that lot size until you are ready to increase your stakes.
Consistent risk-reward ratio
Many people like to trade with a consistent risk-reward ratio as it allows them to analyse their trades on a macro level and compare their actual win rate with their desired win rate.
For example, if you trade with a 2:1 risk-reward ratio, you know that you need a 33% win rate to break even. If you keep track of all your trades, you can easily see how you are performing and just how far above or below breakeven you are hitting.
If you switch between RRRs, it can become hard to keep track of your win rate for each ratio.
The best way to overcome this is to keep track of your trades and write them into your trading journal every time. Make a note of the RRR you used and record the outcome; that way, you can split test your results and see which RRR is performing best for you.
If you stick to one RRR then you will be able to understand how the market behaves during these types of trades and this will help you improve as a trader much quicker.
The skills required to become a great 1:1 RRR trader are far different than those who trade at a 10:1 RRR – stick to one area and hone your skills there.
Note: As always, the RRR is not the be-all and end-all. Set your entry and exit points strategically and be aware of key market levels.
Relative Strengthen Index
The relative strength index, or more commonly referred to as RSI is another momentum indicator that we use in technical analysis that measures the strength in the recent changes of price.
It is an extremely popular tool, you will have likely come across other traders using this tool and often you can find traders having this as one of their only indicators.
It is relatively simple to comprehend and it gives some fairly simple signals to follow when incorporating it into your trading arsenal.
What is RSI?
The RSI is depicted as an oscillator on our trading chart and has a value from 0 – 100 and will look something like this on your chart.
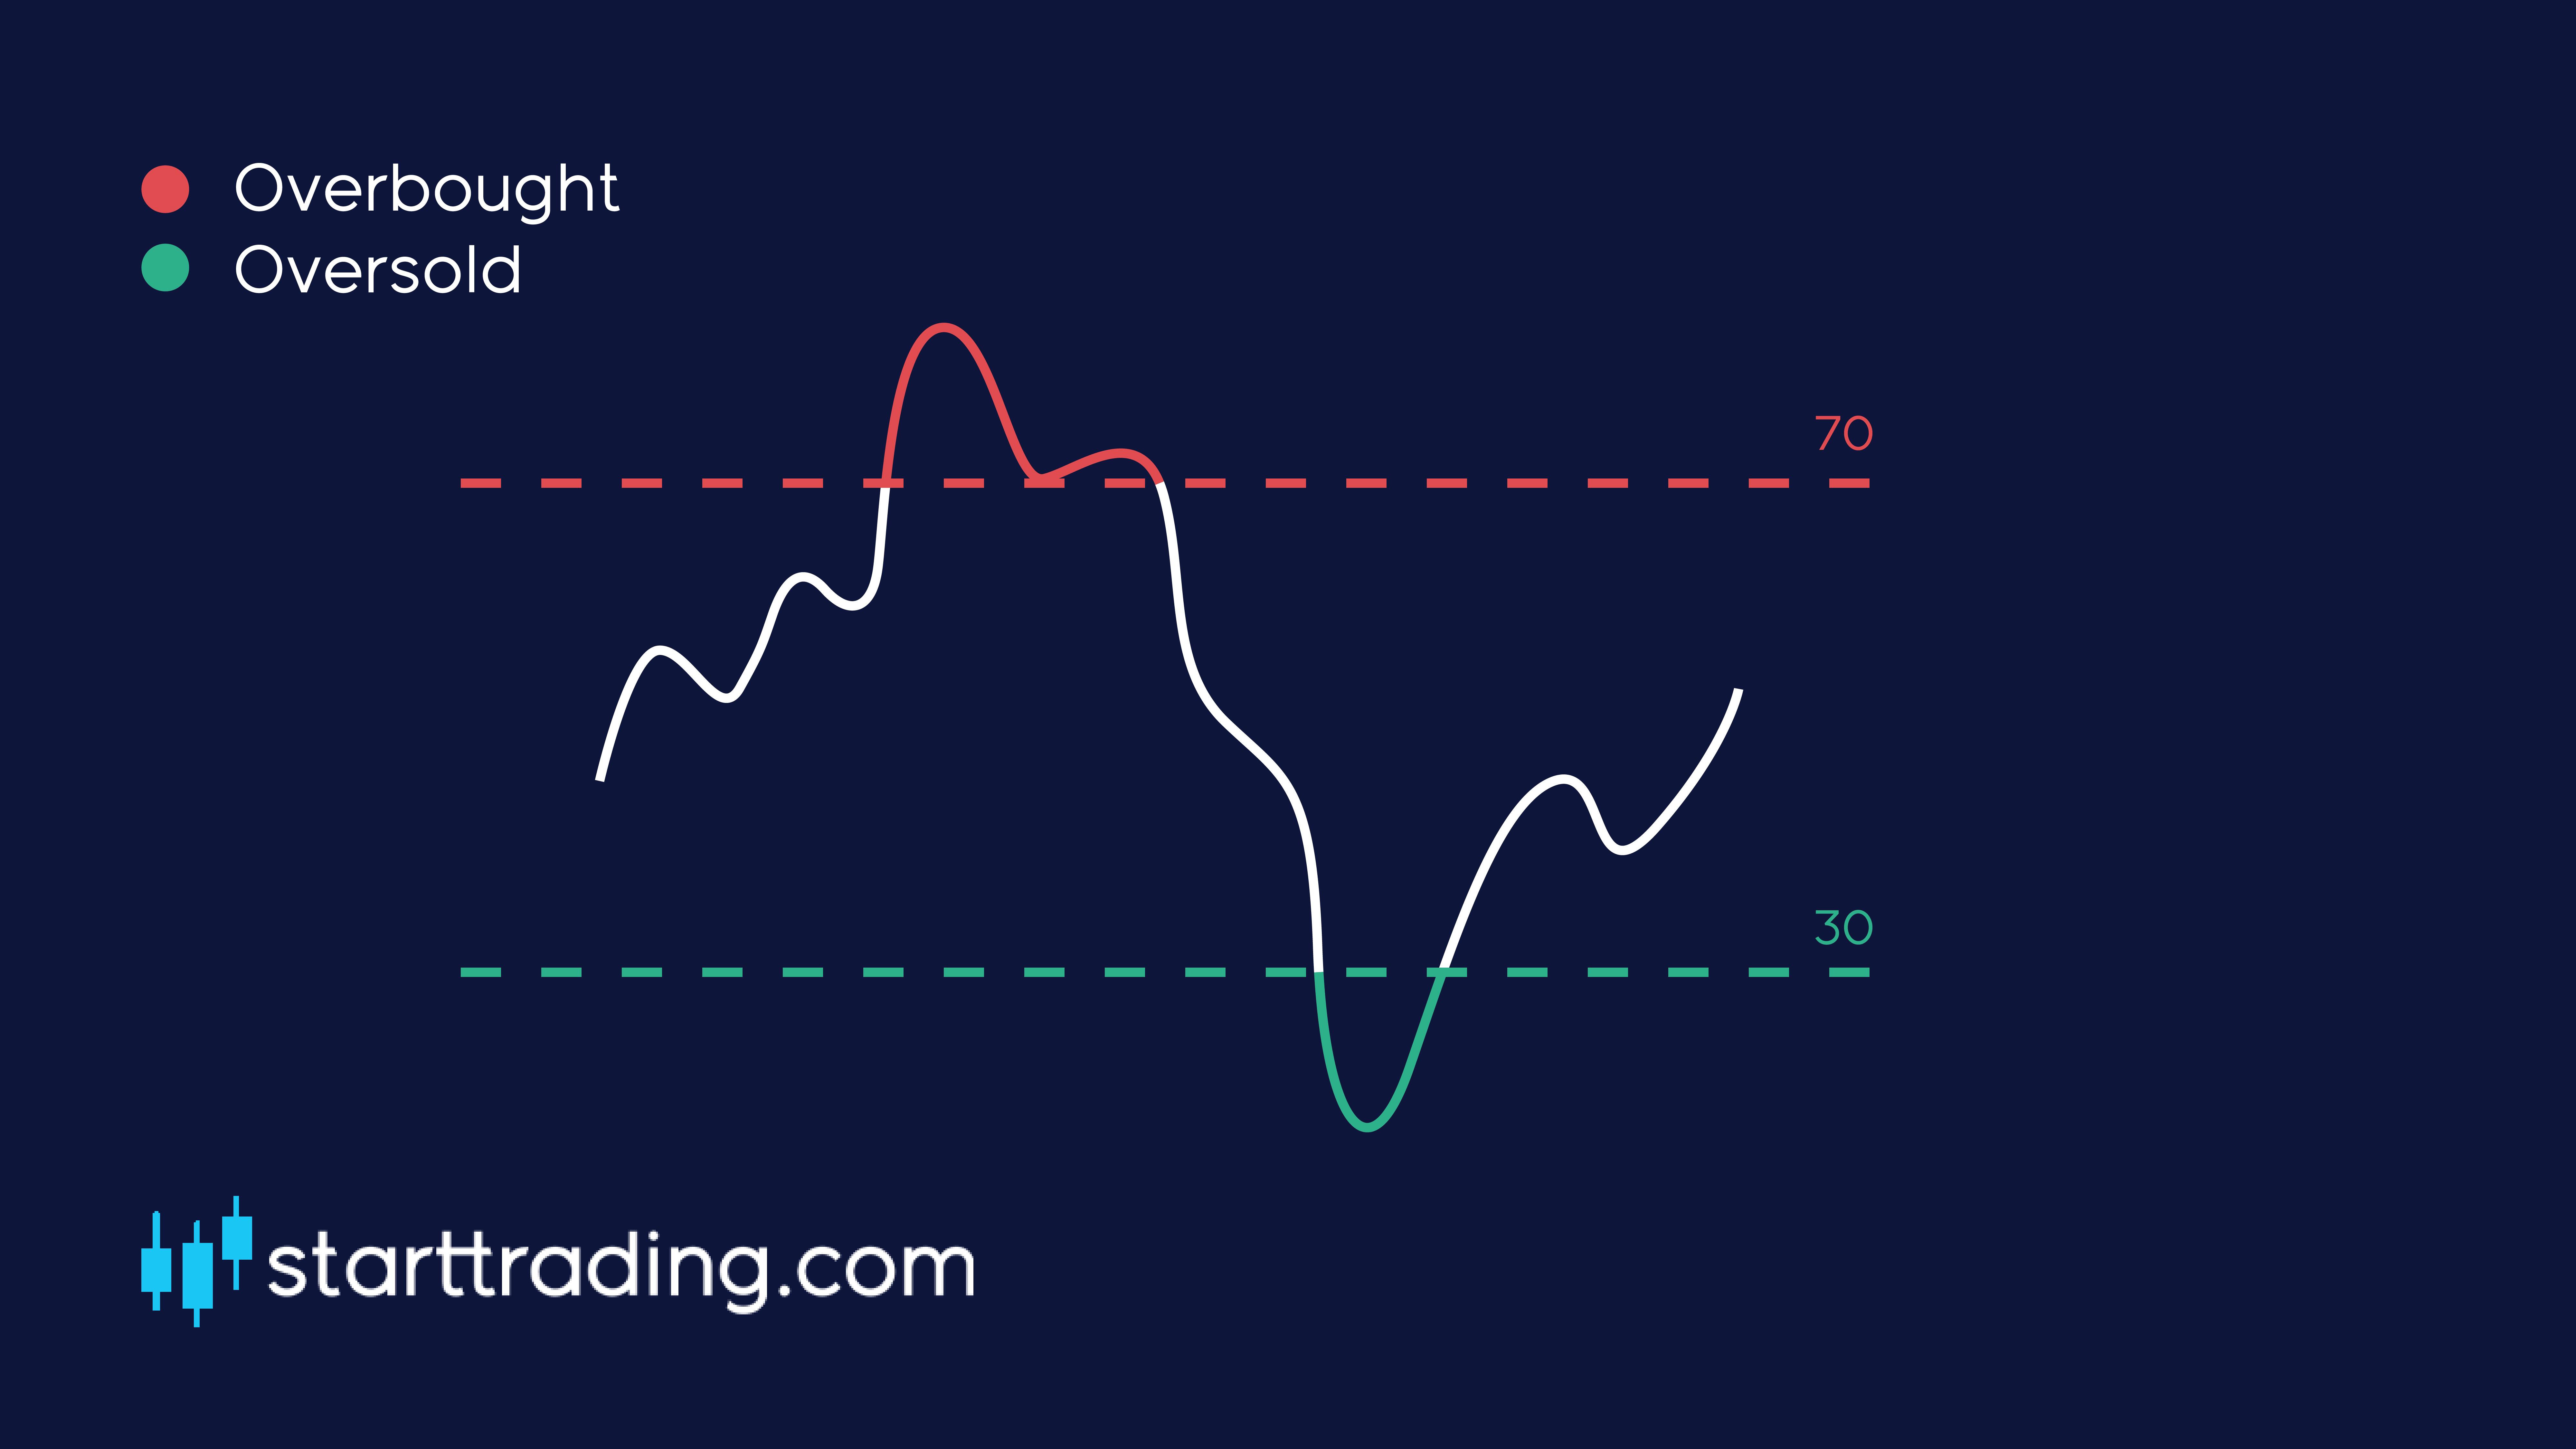
The blue line that you can see on the indicator represents the RSI and what level the market is currently trading at.
The RSI will rise when the number and the size of positive closes increases, and it will fall as the number and the size of negative closes increase. As mentioned, the RSI can only fall somewhere between 0-100, however, there are two very important levels to keep an eye on when it comes to picking up trading signals.
Oversold
As you can see from the graphic above, we have two dotted lines displaying “oversold” and “overbought”.
Typically, when the RSI falls to 30 or below, the market is considered to be oversold. The more oversold the market becomes, the higher the likelihood that the market will rebound and the price will strengthen.
Overbought
The opposite is true for when the market is starting to run out of steam. When the RSI rises above 70, this is considered to be in overbought conditions and the market will be more likely to fall back down.
The higher the RSI goes, the more likely the market will lose strength. What goes up most come down at some point.
Trading signals
RSI is a great tool for recognising when market reversals may be ready to happen. If the market reaches overbought or oversold conditions you should look for other indicators to give you confluent reasons to enter a position.
For example, if you see that the market is about to hit a support at the same time that the RSI hits 30 and is now oversold, that would be a great time to open up a long position.
Double bottom & double top
Okay, now it is time to start looking at some patterns that we can see on our charts. Double top and double bottom patterns appear on our charts when the price action of the currency pair moves in a similar way to the letter “W” or “M”.
The letter “W” represents a double bottom as it shows the price rebounding off of the same price point twice. This indicates a bullish trend reversal.
The letter “M” represents a double top as it shows the price rebounding off of the same price point twice. This indicates a bearish trend reversal.
These are very important technical analysis patterns that we can use as traders to try and predict where the price will move in the future.
Double top
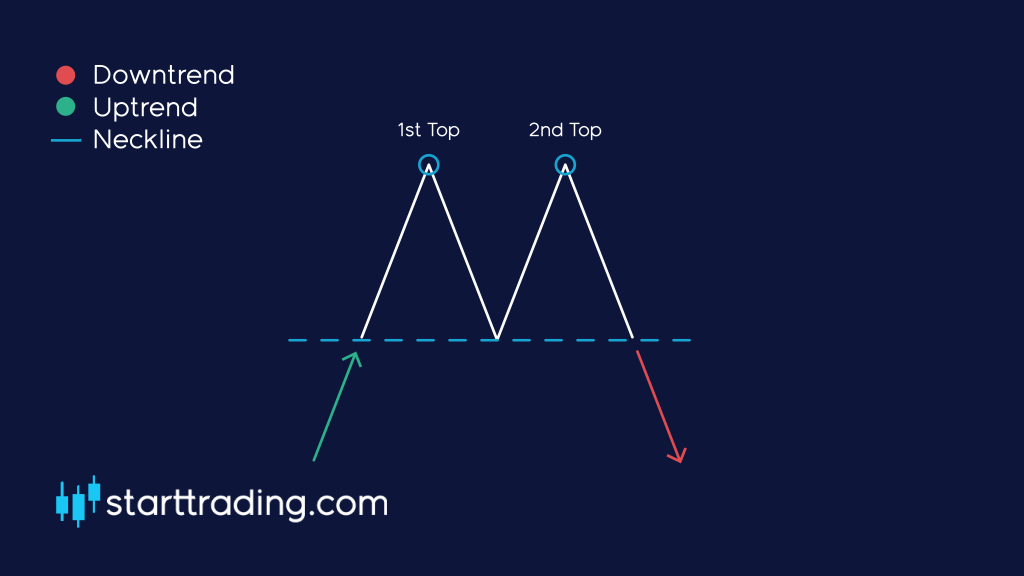
Here is a diagram of a double top. As you can see, the market is in a bullish/uptrend and moves on to create a new high (shown as peak 1 in the diagram). The price then falls down before bouncing back up again to create another high (shown as peak 2).
When the price falls after reaching peak 1, the area that it reaches is referred to as the “neckline”. This is a vital price point that we will come to in just a moment.
For this to qualify as a double top, peak 2 must not exceed the heights of peak1. The bullish trend must try to break new heights but fail and then fall back down to the necklines.
So how do we trade based on this information? During a double top, we would enter a sell/short position when we see the price break the neckline after the second top. The breaking of the neckline confirms the double top and usually signals a bearish trend reversal that we can capitalise on.
As you can see from this example, we have two clear peaks and then a clear break through the neckline following the second peak. This would be our entry point for a sell.
Double bottom
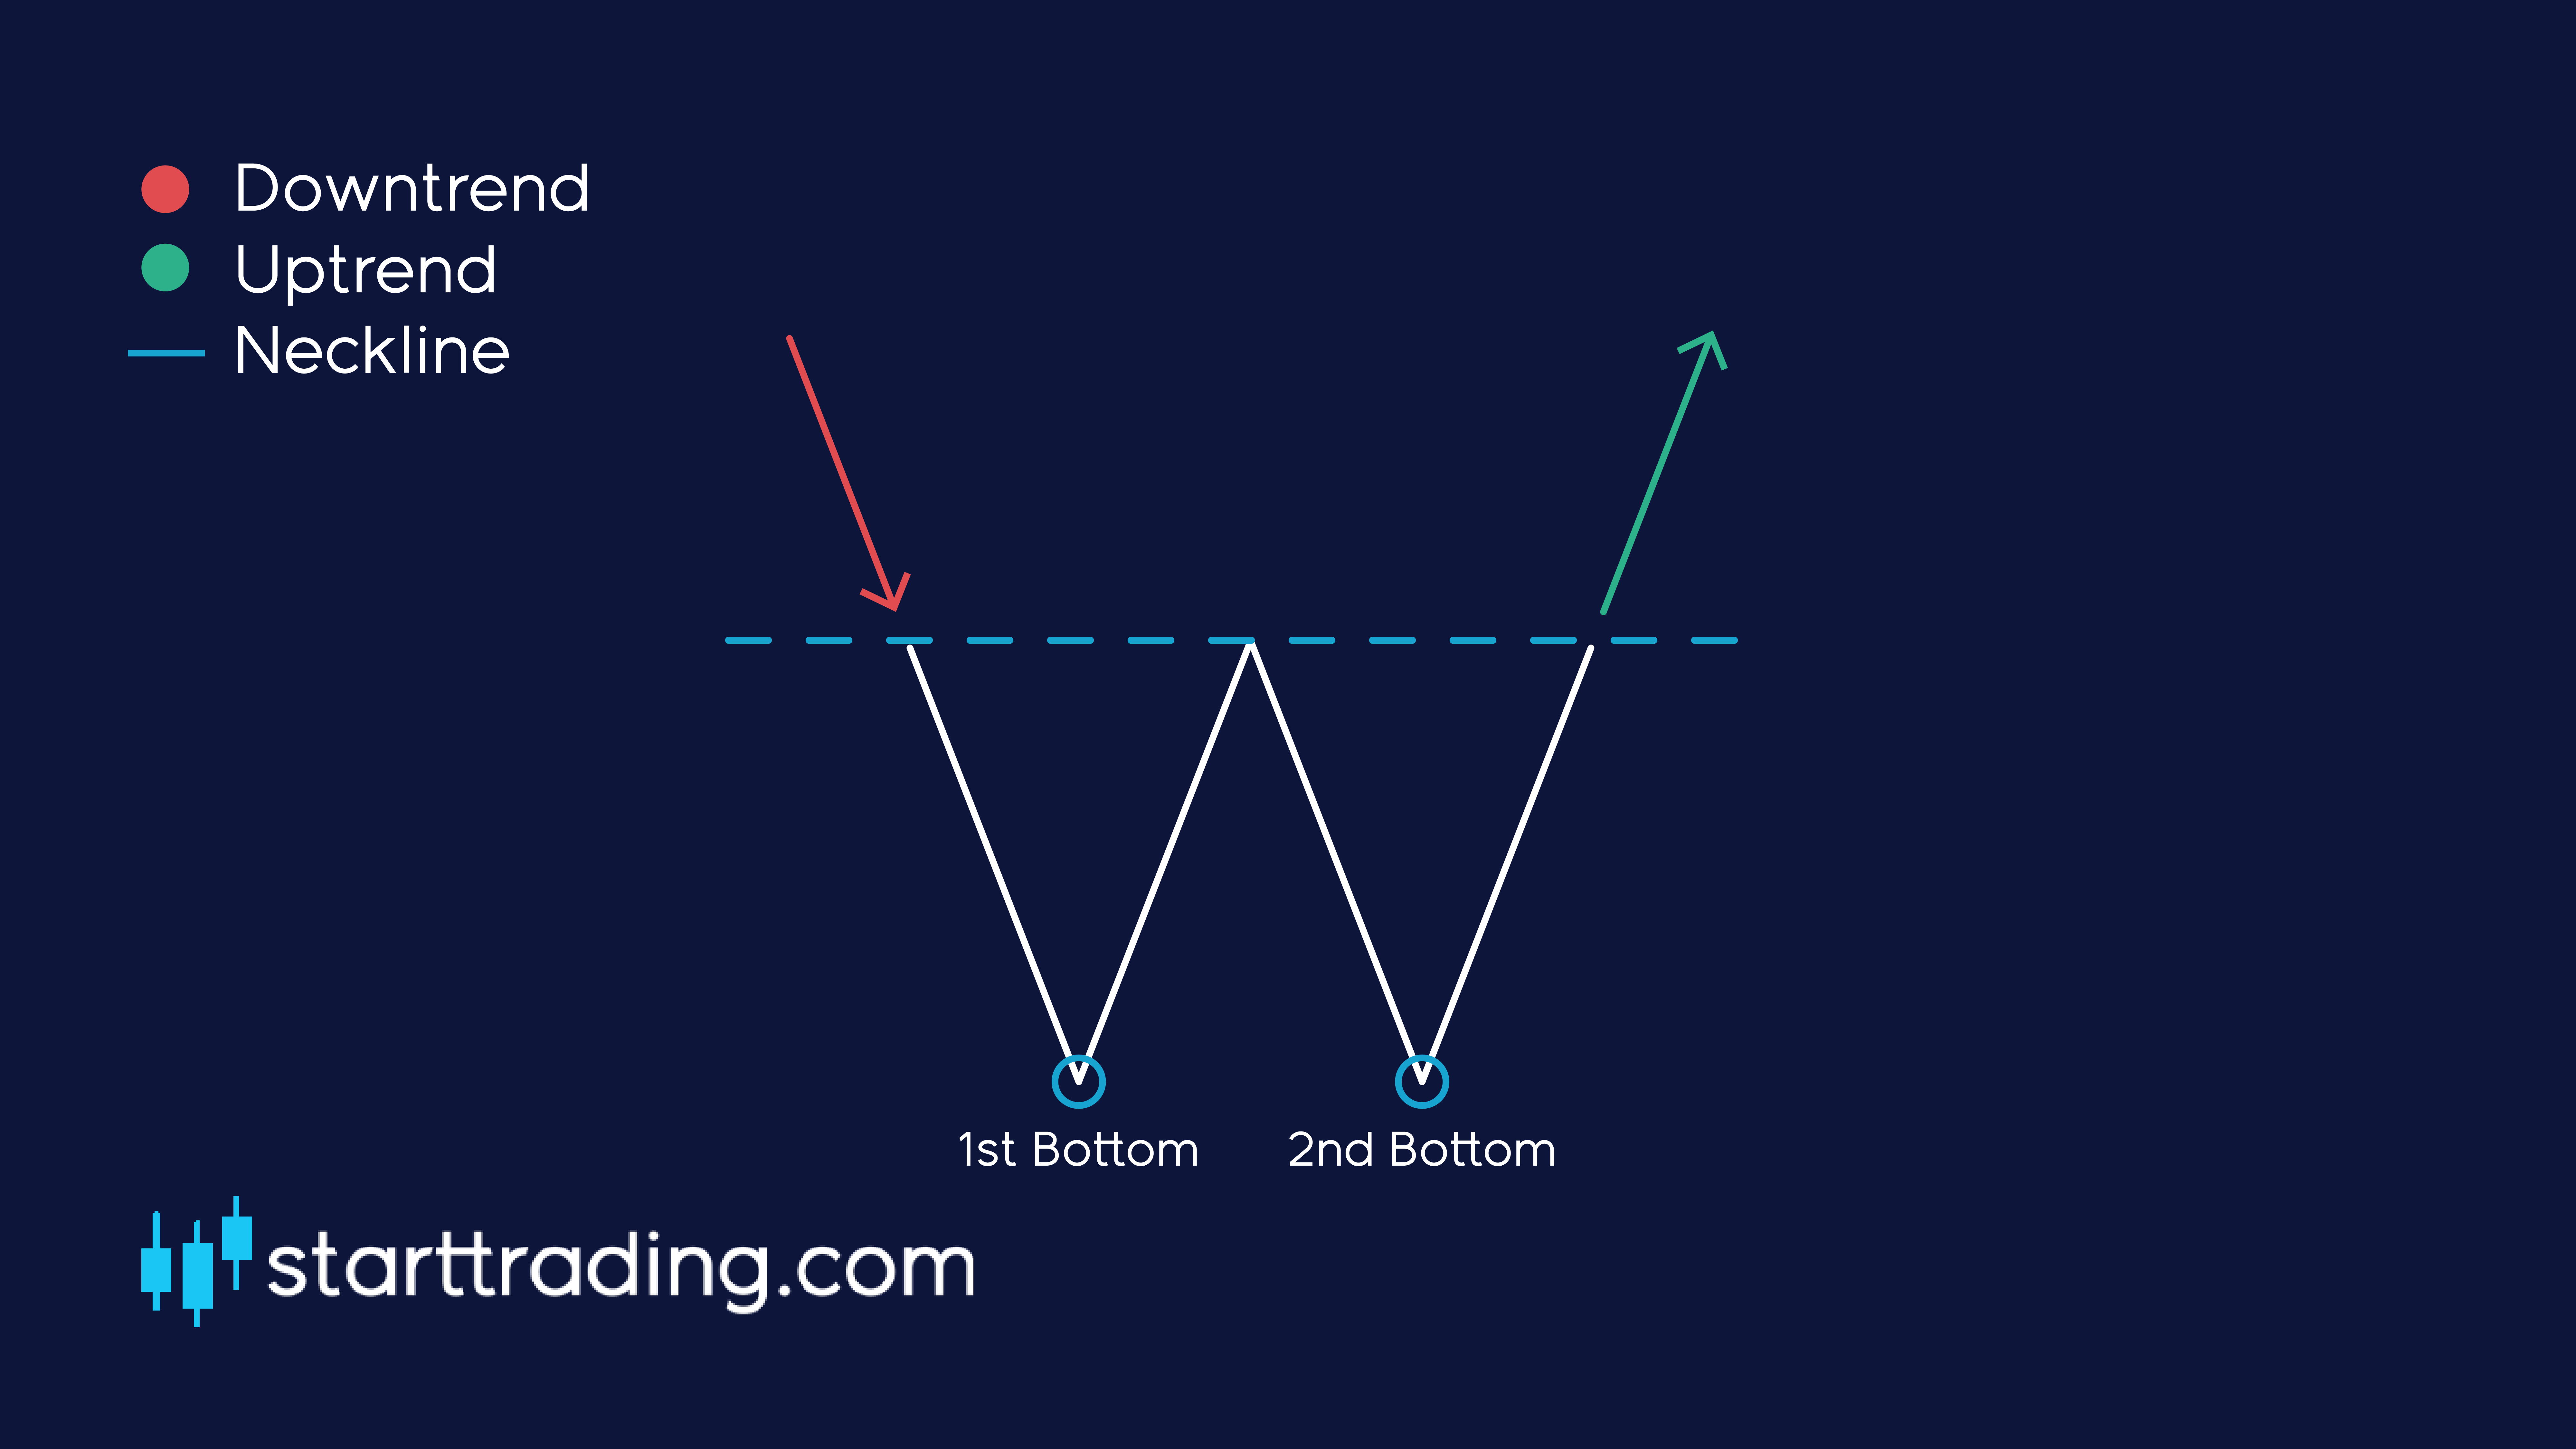
No points for guessing what a double bottom is. Yep, it’s the mirror image of a double top.
Here is an example of a double bottom. As you can see, we had the first bottom followed by a rebound up to the neckline followed by another rebound to the second bottom.
We should enter a long position when we see that the neckline has been successfully broken.
Tip: Double tops and double bottoms can be extremely profitable if we can successfully identify them. However, if you misidentify one then it can be very costly.
Make sure you set a tight stop loss and manage your positions carefully. It may be beneficial to paper trade these patterns for a while before live trading them so that you can practice spotting them without putting your trading capital at risk.
Triple bottom & triple top
Similar to the double top and double bottom patterns, the triple top/bottom works in a very similar way.
It is a pattern that we use in order to identify trend reversals during market uptrends/ downtrends. If we spot them during an uptrend, then this is a very clear signal that the market is about to undergo a bearish reversal.
On the other hand, if we spot them during a market downtrend then this is a clear signal that the market is about to undergo a bullish reversal.
Triple top
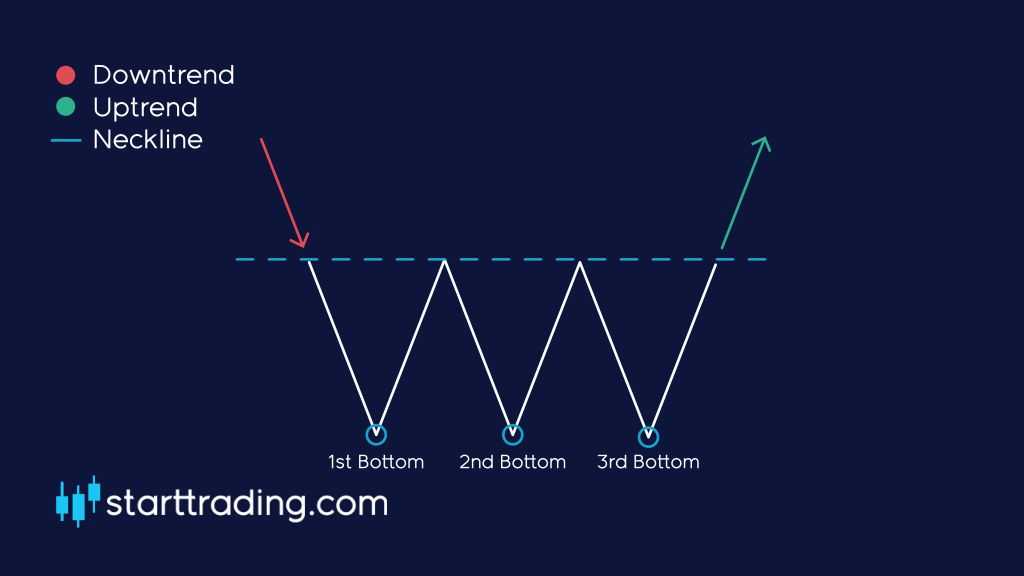
A triple top pattern occurs when we see three subsequent peaks at very similar price levels. As the price has tried to break this price level on three separate occasions and has failed, we can safely assume that this is an area of resistance.
Similar to the double top, the area that the price pulls back to is referred to as the neckline. Should this level break after the third peak then we have a clear signal to enter a sell.
A clear and obvious area to set out stop losses would be above the highest peak in the triple top pattern, which is usually the first peak. If the trade was to break that price level the trade has become invalid and the triple top did not form correctly.
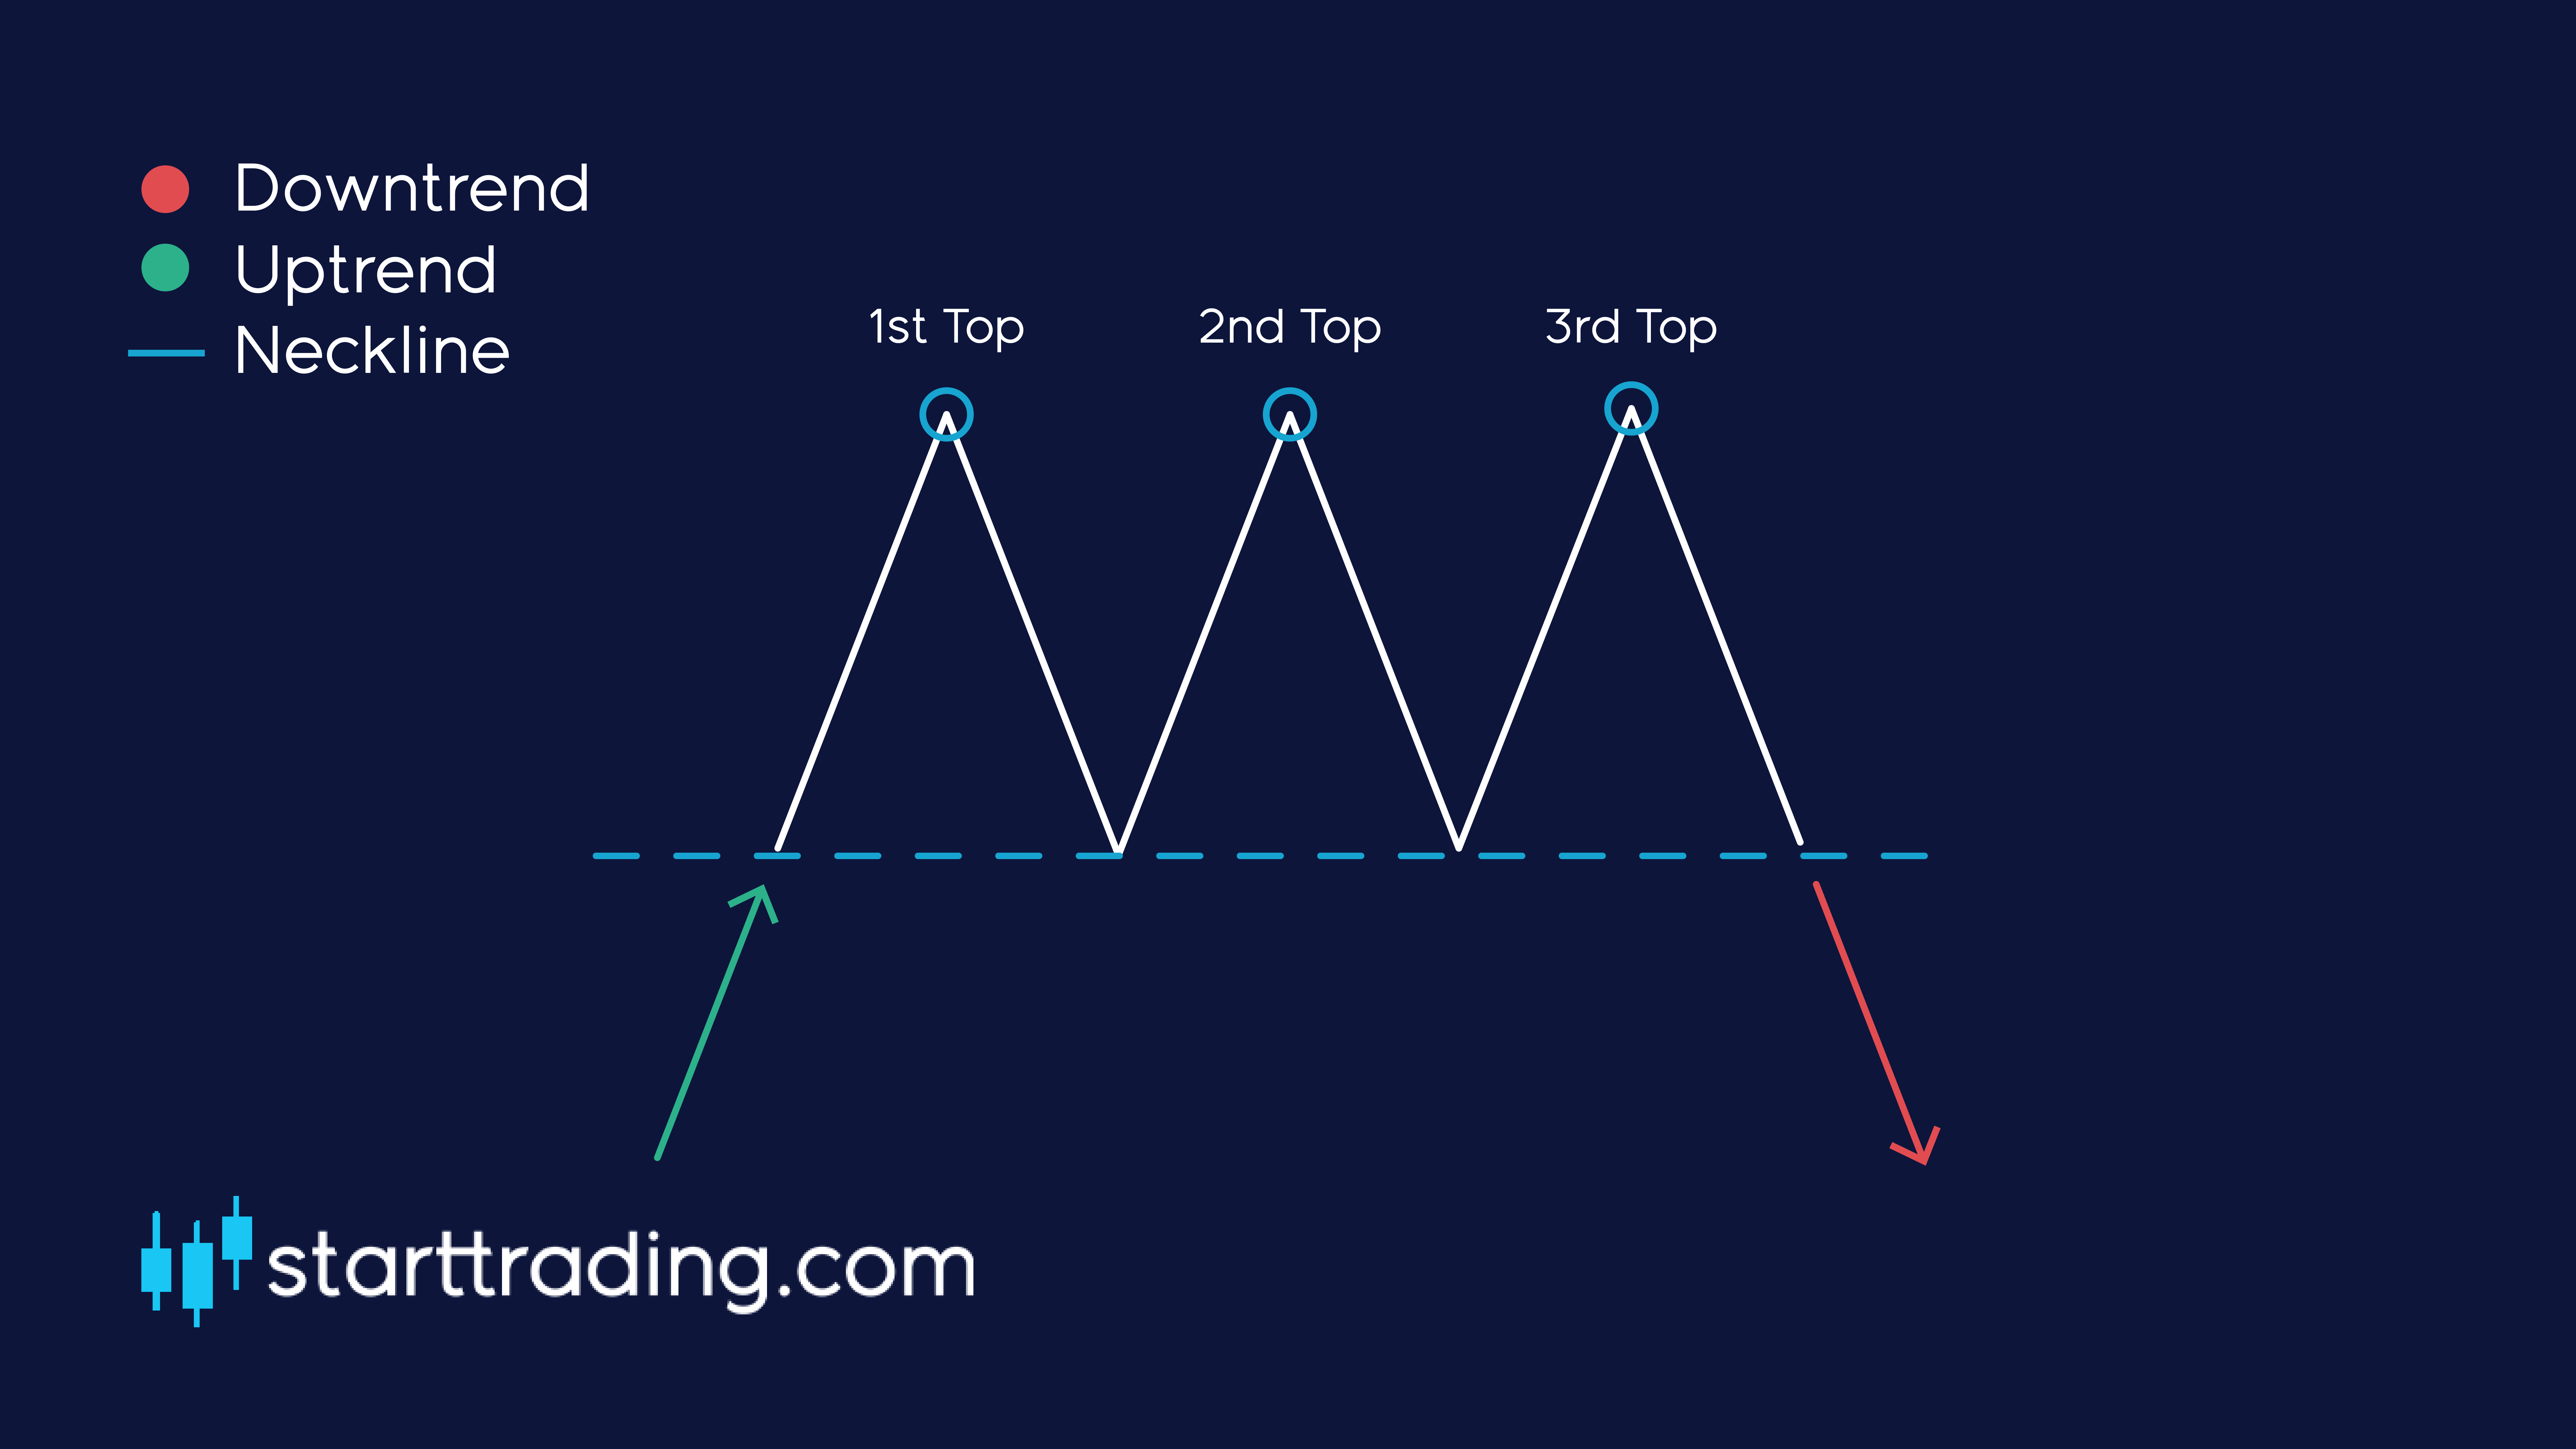
As you can see from the image above, the price created three peaks that it failed to break and then eventually broke out of the neckline support after the third peak. This was a clear point for us to enter a SELL position.
Note: We can obtain a clear take profit point when trading this method by looking for the price to retrace at least the same distance between the top of the peak and the neckline. We can use this as a guide to where to expect the price to reach.
Triple bottom
The triple bottom is the exact mirror image of the triple top. Here is an example.
The exact same principles apply to the triple top, so just trade it the exact same way that you would a triple top, except for this time we enter a LONG position upon the break of the neckline.
Head & shoulders
To keep in the theme of the recent lessons, the head and shoulders pattern is another trend reversal pattern that we can use to identify when the market may be about to turn.
This pattern is also similar to the double top/triple top patterns and we trade it in pretty much the same way, with only a few variations. First of all, here is an example of a head and shoulders pattern.
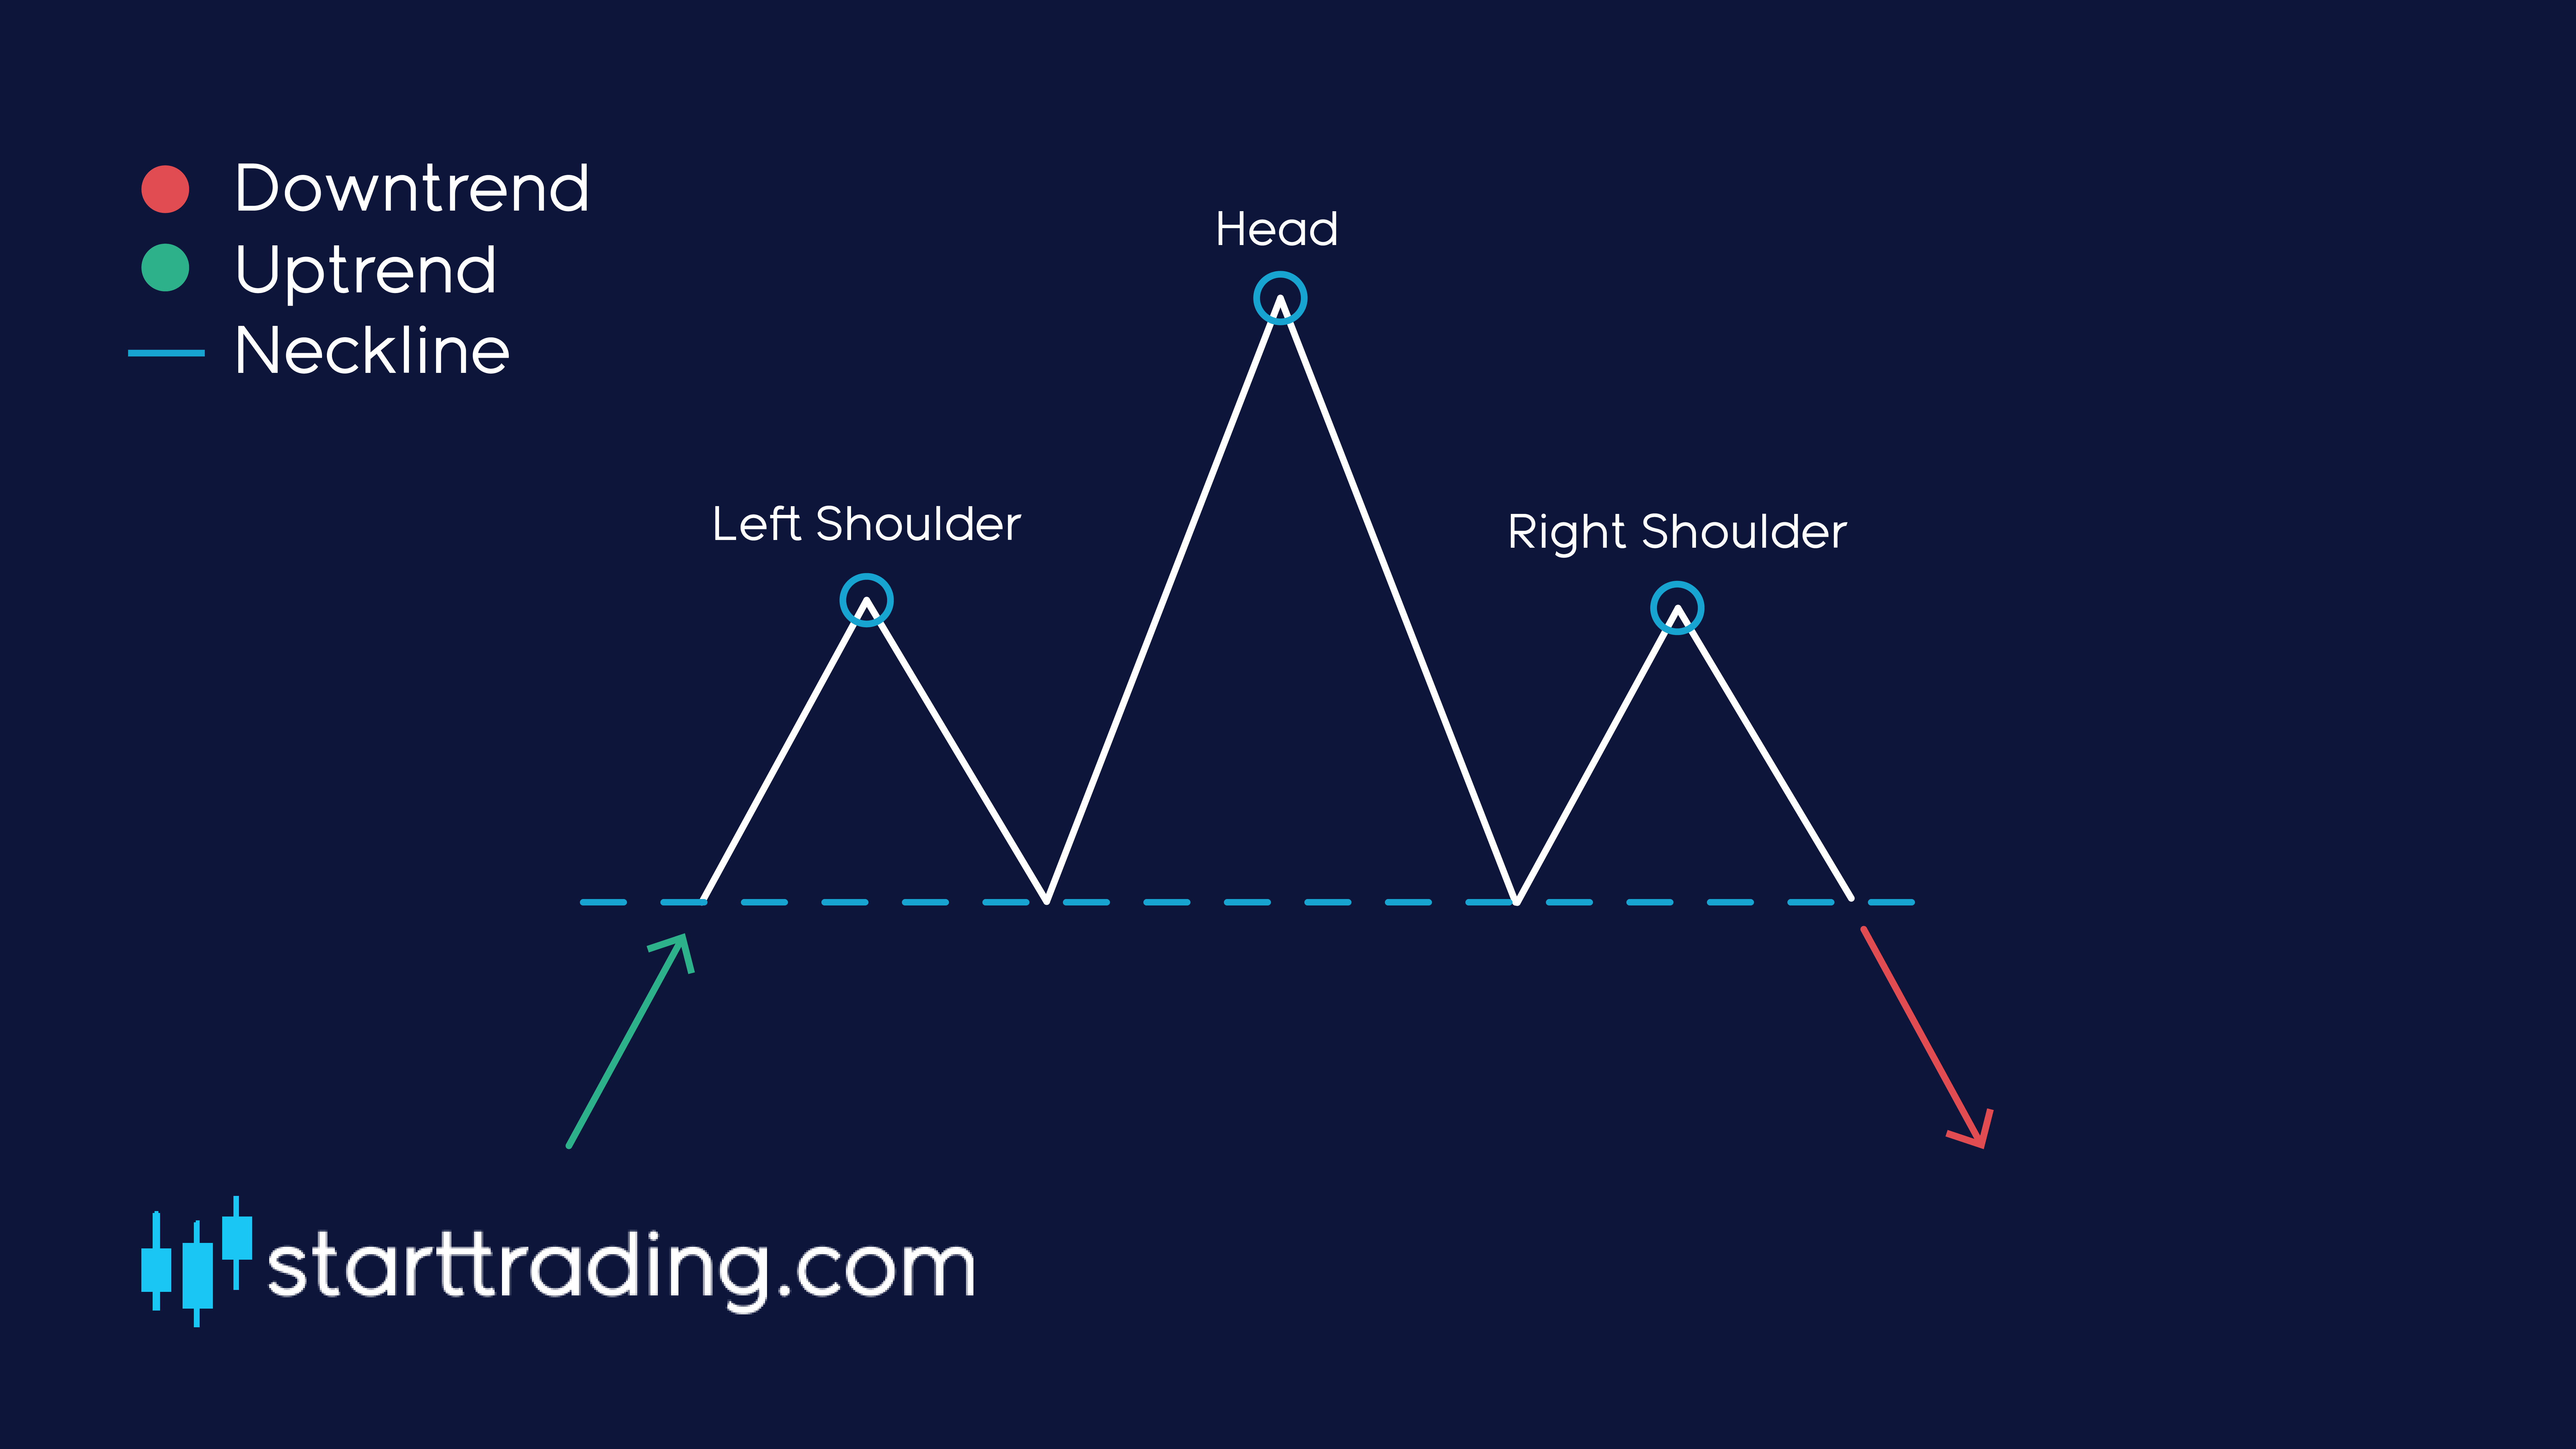
As you can see from the image above, it is very similar to the triple top, however the peaks are of different heights and the neckline is not strictly horizontal.
A head and shoulders pattern is formed first by a peak (the shoulder) followed by a higher peak (the head) followed by another lower peak (the second shoulder).
In this instance, we draw the neckline by connecting the two lowest points that are visible from the pullbacks. More often than not the line will not be straight, but don’t worry this is typical for a head and shoulders pattern.
So how do we trade this? Well, we use the exact same method as the triple top and double top. Simply wait for a clean break of the neckline and then enter our SELL positions. We can expect a pullback to be a similar distance to the difference between the head and the neckline.
Tip: Some traders say that the signal is more accurate when then neckline is a downslope. This would signify that the market is clearly losing strength and the possibility of a clean break of the neckline is more likely.
Inverted head and shoulders
As with most of these patterns, there is always a mirror pattern that works in the exact same way. Here is an example of an inverted head and shoulders pattern.
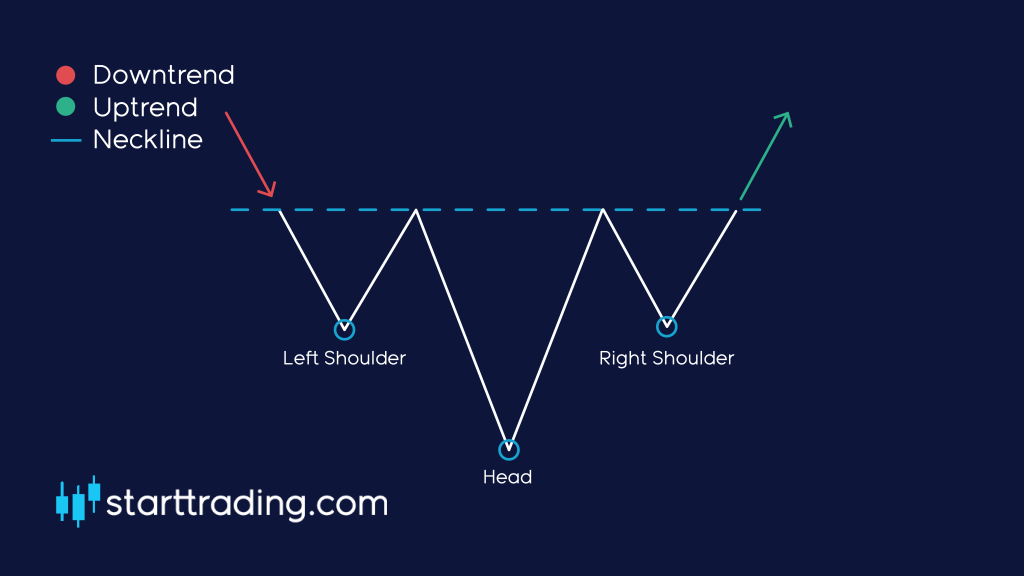
As you would expect, the inverted head and shoulders pattern only arises in a downtrend and must meet all of the same criteria as the standard head and shoulders pattern.
We simply place a LONG once there is a clear break of the neckline and the trend reversal is confirmed.
Triangle patterns
Last but not least in Unit 4 we have triangle patterns. These are common chart formations that occur relatively frequently, so it is important that you get to grips with them fairly quickly.
Here we will cover the three main types of triangle patterns and show some examples. They are the ascending, descending and symmetrical triangle.
Ascending triangle
An ascending triangle occurs when there is a clear horizontal resistance level followed by a string of higher lows. It should look something similar to this.
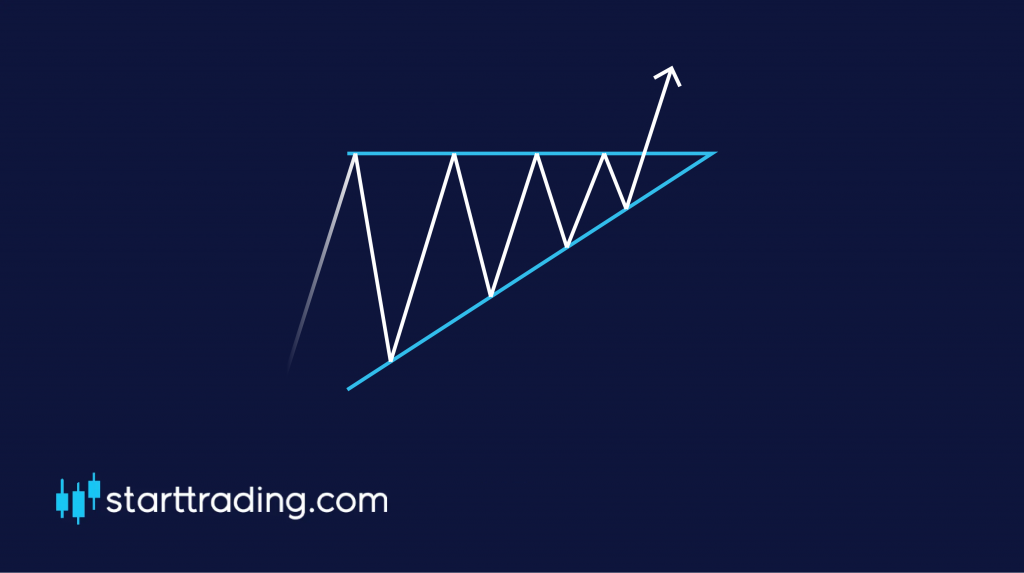
As you can see, the price is clearly struggling to break through the resistance but the market is showing strength with continued higher lows signifying an uptrend. Eventually, this will come to a point and the market must decide where it is going from here – a breakout is bound to happen.
In an ascending triangle the price will usually break through the resistance and breakout to the upside. However, that is not always the case. You should be ready for both eventualities.
Wait for a clear break of the pattern and set your stop loss at the point where the breakout becomes invalid again. For example, open a BUY order just above the resistance level and set up a stop loss just below the support level of the ascending triangle.
Descending triangle
Yep, you already guessed it. A descending triangle is the exact opposite of an ascending triangle. You should look for a horizontal support line that has continually held the same level while there is weakening price action showing a series of lower highs.
Here is an example of a descending triangle:
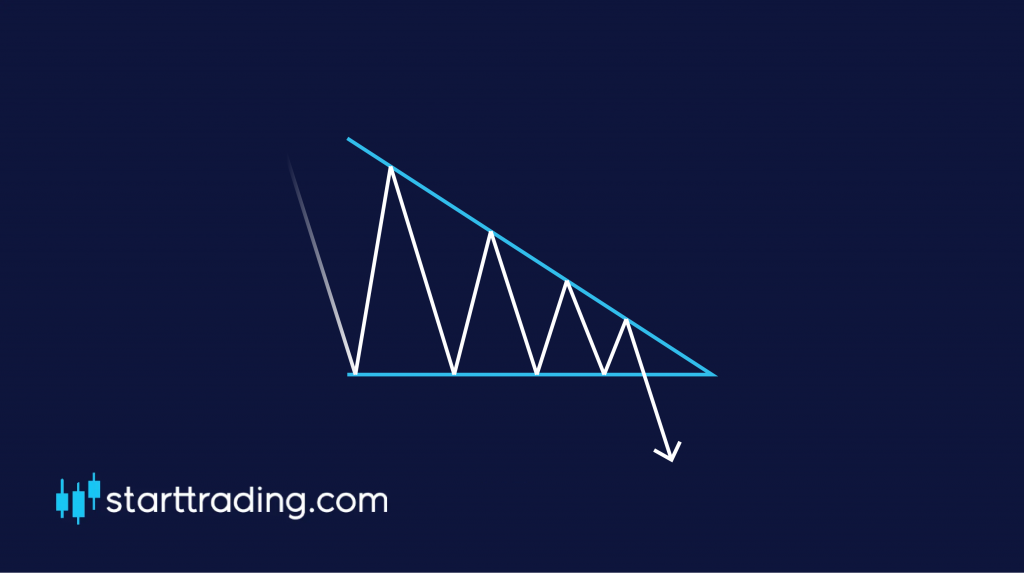
Most of the time, the price will break to the downside. The best way to trade this setup is to set a sell order just below the support and set your stop loss at the point of invalidation, which in this case would be located just above the resistance point of the triangle.
Symmetrical triangle
Last but not least, we have the symmetrical triangle. This pattern is an indication of market consolidation. This means that the market is not trending in any particular direction at the moment and could be prone for a breakout to either side.
These patterns occur when the market is making a series of lower high and higher low, like this:
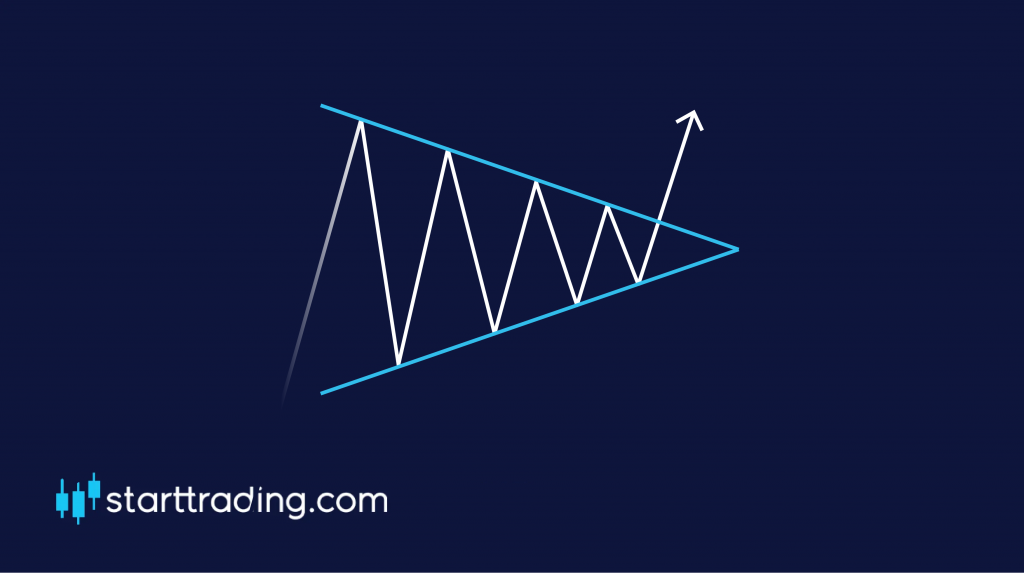
So how do we trade this? Well as we can be pretty sure that a breakout is coming in one direction it is better to prepare for both eventualities. Set up your long orders just above the triangle resistance line and your sell orders just below the triangle support line.
This ensures that you will catch the breakout in whatever direction it goes in. Remember to set your stop loss at the point of invalidation, which will be at the opposite side of the triangle that you opened your order.
A quick word on indicators and patterns
That about wraps it up for unit 4. It is worth quickly reiterating the importance of using a combination of these trading indicators in order for us to be successful.
If we rely too heavily on one signal then we will certainly be shooting ourselves in the foot as we won’t be trading as optimally as we could.
It is advised to use bottom up analysis while looking for multiple confluent reasons to enter a trade. The more reasons you can find to enter a trade, the better.
This may mean that you miss out on a number of winning trades, however, you will vitally avoid those losing trades that can be so damaging to our trading balance and to our mentality.
“Sometimes the best trades you make are the ones you don’t take”.
MACD
Now that we have got the basics of the moving averages and relative strength index covered, we can move on to something a little more complex, the MACD.
MACD stands for Moving Average Convergence Divergence and it is a trend-following momentum indicator. Sounds fancy right?
At first sight, the MACD can look a little confusing and potentially intimidating to new traders but don’t worry, it doesn’t have to be.
Let’s break it down:
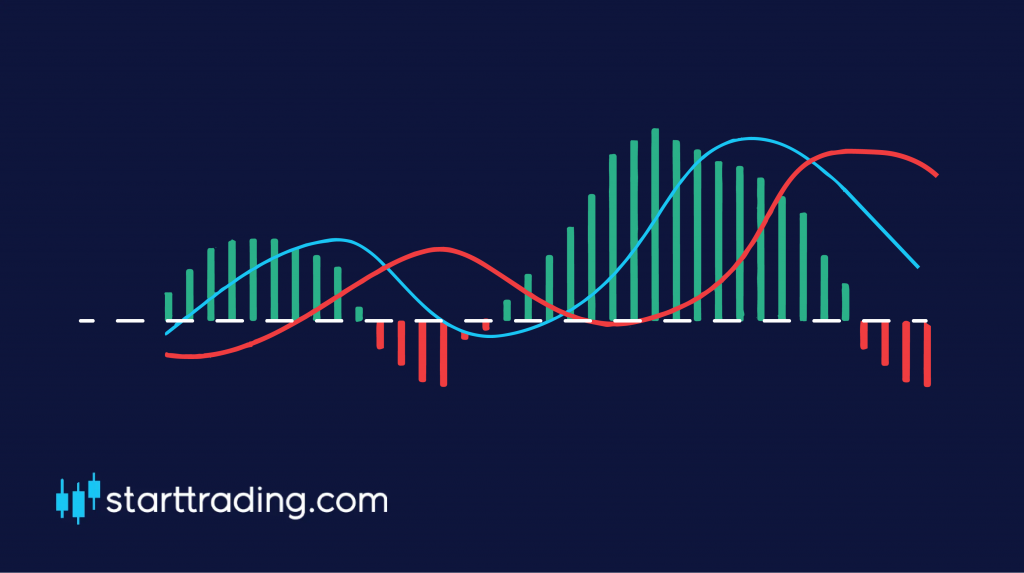
The horizontal line in the middle is the “zero” line and acts as our base point.
The next line to get plotted is the “MACD” line which used the 12-day and 26-day EMA. It is calculated by subtracting the 26-day EMA from the 12-day EMA. This is the red line in the image.
The next line that is drawn on the MACD is the “signal” line which is simply a 9-day moving average of the MACD line. This is the blue line in the image.
The red and green bars that you can see on the chat are what is called the “histogram”. This simply indicates how far away the two lines on the MACD are from crossing over with each other. As you can see, the closer they get to crossing, the closer the histogram gets to the horizontal “zero” line.
Bullish or bearish
To put it simply, the market is considered to be bullish when the MACD and signal lines are located above the zero line and it is considered to be bearish when they are both found to be below the zero line. Simple stuff.
So how do we trade with the MACD?
Trading with the MACD is simple. We simply wait for a crossover to occur between the two lines on the chart and then enter our positions accordingly.
If there is a crossover below the zero line then this indicates a change in momentum and is a signal for us to BUY and open up a long position.
If there is a crossover above the zero line, then we would consider this to be a SELL signal as the trend may be reversing as the buyers are “running out of steam”.
Moving averages
The moving average is one of the most commonly used technical indicators, and for good reason. They are relatively simple concepts to grasp and they give us a simple view of the market trends and the recent price history.
So what is a moving average?
A moving average is simply a line on our chart that signifies the closing price of each candle over a specific period of time.
You will notice that the charts we view can often seem chaotic with wild price fluctuations which make the graphs somewhat hard to read. Moving averages help to make sense of this by creating a smooth line that shows the historical price action.
The main purpose of a moving average is to be able to more easily identify trends and to spot reversals as they are happening.
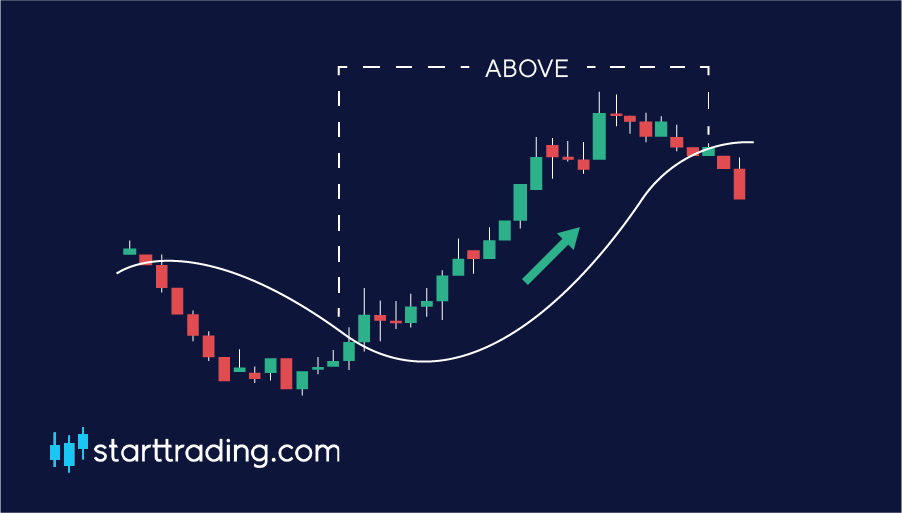
When the price of the currency pair is shown to be above the moving average, this is considered to be an uptrend.
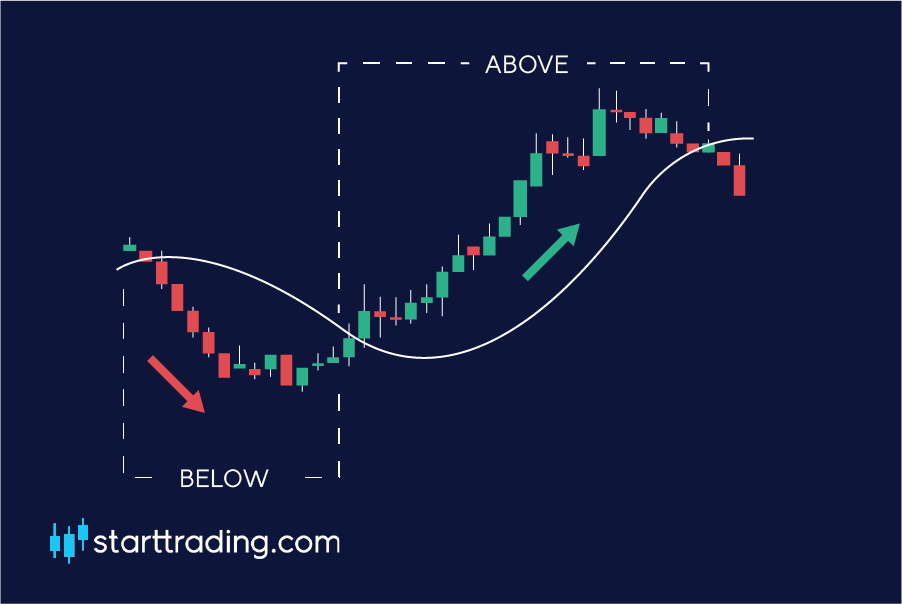
On the other hand, when the price is shown to be below the moving average, this is considered to be a downtrend.
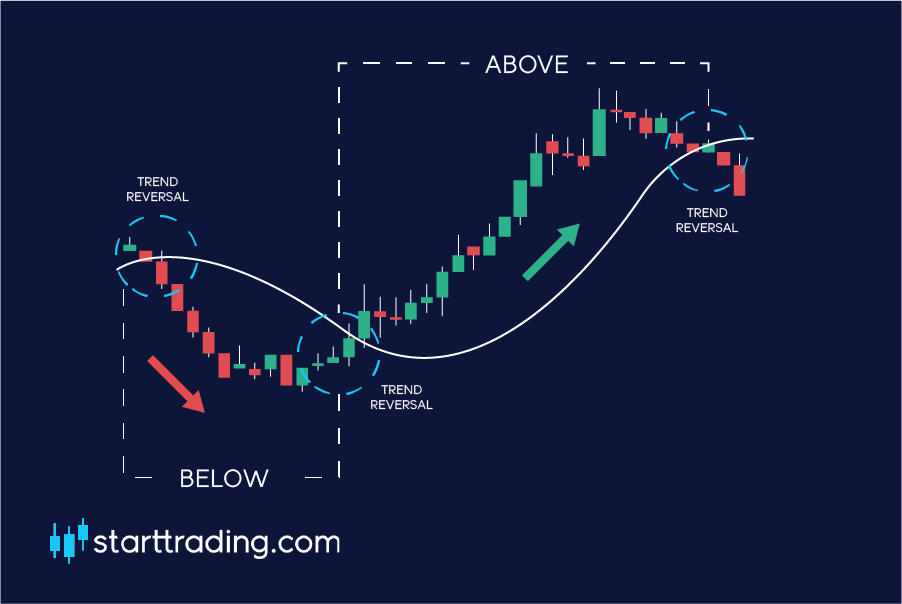
When the trend line is broken, we would consider this to be a trend reversal.
Note: Moving averages are based on past prices and are known as lagging indicators. This means that the information they are displaying to you has already happened. They can not predict when a trend reversal will happen, they can only confirm it once it has happened.
There are a few different types of moving average that we can use in our trading arsenal. The main two that we will consider in this course are the simple moving average (SMA) and the exponential moving average (EMA). Let’s break each one down in more detail.
Simple moving average
Let’s say that we are using a 5-day SMA for our chart. This means that our moving average line will represent the average closing price of the previous five days.
For example, if the closing price over the last 5 days were $1.63, $1.65, $1.70, $1.67, $1.62 our calculation would look like this:
($1.63 + $1.65 + $1.70 + $1.67 + $1.62) / 5 = $1.65. So in this case, our 5-day SMA would be at $1.65.
The longer the period of time that the SMA covers, the less reactive it is to current price changes and fluctuations in the market.
As each of the price points has equal weighting, the most recent price action effects the market just the same as the last price point the SMA uses in its calculation.
This can be problematic to traders as it means that the SMA is slower to react to rapid price movements that may prove to be important.
Exponential moving average
This is where the exponential moving average (EMA) comes in. The EMA gives more weight to the recent price movements which in turn makes it more reactive to the recent events in the market.
This can be beneficial to a lot of traders as trend reversals can be spotted more quickly as the more reactive EMA will display shifts in sentiment over the SMA.
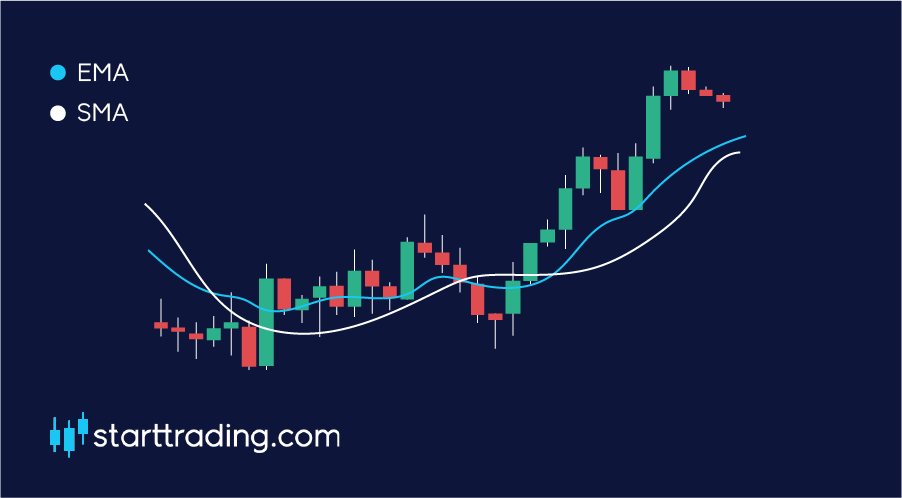
Due to this, when you look at a chart with both the SMA and EMA visible at the same time, you can see that the EMA is closer to the actual price and is more volatile than its counterpart.
When trading, it is much more important to be able to visualise what is going on right NOW with the price action rather than what was happening in the market previously.
Length of the moving average
The period of time that the moving average covers will make a significant difference to its position on each chart. That’s why most traders utilise multiple MA’s at the same time. Here are some of the most commonly used:
10-20 – Short term trends
50 – Mid term trends
200 – Long term trends
How to trade with moving averages
Moving averages act a lot like support and resistance lines. As many traders are using them at the same time, they are often met with a reaction when the price nears these points. Keep this in mind when doing your analysis.
Look for a bounce or a breakout of these points and then enter your positions accordingly.
As a rule of thumb, when the price is below the MA it will act as resistance for the price to break through. Conversely, when the price is above the MA it will act as a support.
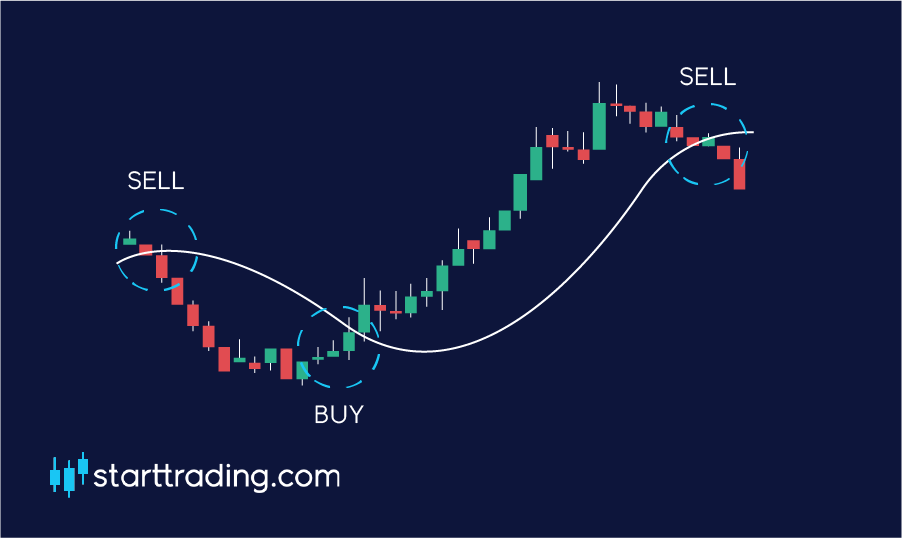
Because of this, when the price has successfully crossed up and over the moving average line, this would be considered to be a buy signal.
On the flip side, when the price crossed the moving average line to the downside then this would be considered a sell signal.
Top down & bottom up
When we trade the forex markets, we are always looking for the optimal moment to enter our positions. At the end of the day, trading is all about timing. If we mistime our trade then we can miss out on potential profits, or worse, we can take a loss.
The best way to ensure our trades have the best chance of being timed correctly is to conduct top-down or bottom-up analysis.
They are both relatively simple concepts, however, you must make sure that you apply these strategies to the majority of your trades if you wish to have the best chance of success.
Here’s how each one works.
What is top-down analysis?
Top-down analysis is a trading style where you start your analysis from the larger time frames “the top”.
When you are looking for trade setups, you will be looking at the higher time frames, such as the daily or even the weekly. This gives you a very zoomed out view of the market which allows you analyze it on a macro scale.
Once you have found your ideal set up, you must then zoom in and analysis the next time frame down to make sure that the set up is still valid. Picture it like zooming in with a magnifying glass to confirm your initial theory.
As we mentioned in the last unit, the more confluent reasons you have to enter the trade, the more likely it is your trade will be successful.
If you have found a trade set up on the daily chart and it is still valid to enter on the H4 and H1 then you can enter a position with a higher level of confidence.
Benefits
- Focus on the bigger picture
- Less noise when compared to the lower time frames
- Easier to see the key levels
- The levels on higher time frames are typically more crucial therefore it is vital that we have an understanding of where they are and how they will likely impact the market when they reach these levels.
What is bottom-up
If you haven’t already guessed it, bottom-up analysis is when we start with our eye on the lower time frames and then work our way up from there.
Let’s say you are scanning the 15 minute time frame chart and you find a great trading set up. Maybe the price is just about to hit a huge support that your analysis has highlighted and you are looking to enter a long position.
Would this be enough information alone to enter a trade? The answer is no, it wouldn’t.
In this case, it would be much better to go one-time frame higher to have a look at the 30-minute chart to see if our trade is still valid. It would be better yet and much safer to go even higher and look at the 1HR and 4HR time frames, too.
The reason why we do this is to make sure that the route is clear for our trade. The smaller time frame may be screaming BUY but on the higher time frames, there could be a huge resistance in the way that could seriously impact your trade.
Remember, the trend is your friend. If you are looking to buy then make sure that the trend on the higher time frames is upwards, too. You’ll be making your life a lot easier if you do.
Benefits
- Much easier to spot setups on lower time frames
- Helps to avoid overtrading
- Ensures that your trades aren’t going to run into problem areas that are contradicting your setups
- It gives you more confidence and will likely see you maintain a much higher win rate.
Advanced candlesticks
What we have just previously covered is the absolute basics of candlestick chart reading. For us to become more accurate traders, we need to add advanced candlestick reading to our trading arsenal.
Don’t worry, it’s pretty straight forward as all you have to do is remember what each of the candle formations mean.
A good tip is to print out a candlestick cheat sheet and have it in front of you at all times while you are trading.
That way you have a quick reference of what you are looking at on your trading screen and you will help you to memorise each of the candlestick types.
Marubozu
A marubozu candle is a candlestick that has no shadows or wicks visible, all you can see is the real body of the candle.
This means that the price opened and one point and them continually moved in the same direction until it’s close. It also means that it closed at the lowest/highest point that it reached.
A green Marubozu candle is extremely bullish as it means the bulls had control during the entire formation of the candle. On the other hand, If it is a red candle, it is extremely bearish.
Doji
Doji candles are easily visible on the chart as they will typically look like a cross sign. This happens because a doji has the same open and close price, meaning that their bodies are very small.
However, dissimilar to the marubozu, a Doji candle will usually have a shadow and wick as the price has tried to move in one, or both directions but has inevitably closed at the same point in which it opened.
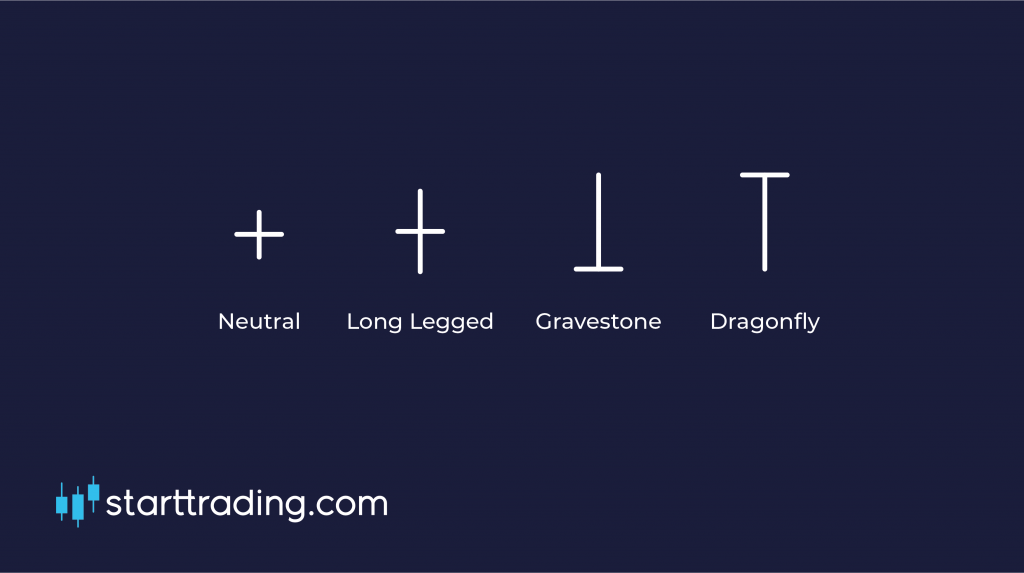
As you can see from the image above, there are four types of Doji, neutral, long legged, gravestone and dragonfly.
A doji normally signifies a point of indecisiveness and struggle within the market. The price has not moved and it highlights a point of equilibrium between buyers and sellers.
It is important to consider the candles that immediately precede and follow the doji candle as it can give a great insight into where the market is moving next.
If a Doji is created at the top of an uptrend then it may signify what we would call “buyer exhaustion”. This means that there are fewer buyers left at this price point and it could signify a reversal of the trend. The same can be said for downtrends, too.
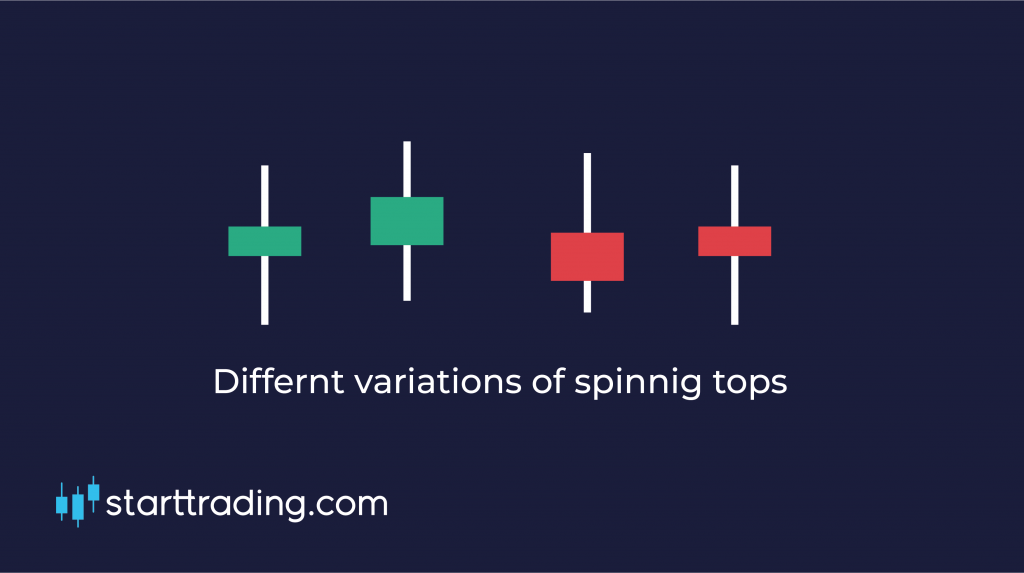
Spinning Top
A spinning top is very similar to a doji and signifies pretty much the same thing. They are created when we see long wicks to both sides of a small candle body, hence the name spinning top.
They signify that the market may be slowing down during a trend and that there may be a possible reversal as neither the buyers or sellers have managed to gain a foothold during the candle formation.
Candlesticks
Okay so before we continue any further, we had better clear up exactly what candlesticks are and how you should interpret them.
They may only seem like a small insignificant red and green lines on a chart, but each one of them tells a whole story that we should be paying attention too. So what exactly is a candlestick?
To put it simply, candlesticks are a type of chart that we use to easily display the high, low, open and close of a particular time period.
Whatever time frame the chart is that you’re trading, that signifies the length of time it takes to form each candle. For example, If you are looking at five minute chart, then each candle represents five minutes.
You will sometimes see these referred to as Japanese candlesticks, which is where the idea originated from back in the 1700’s. They were originally created so that the Japanese people could monitor the fluctuations in the prices of rice.
It is only in relatively recent history that these have come back and become synonymous with trading the global markets.
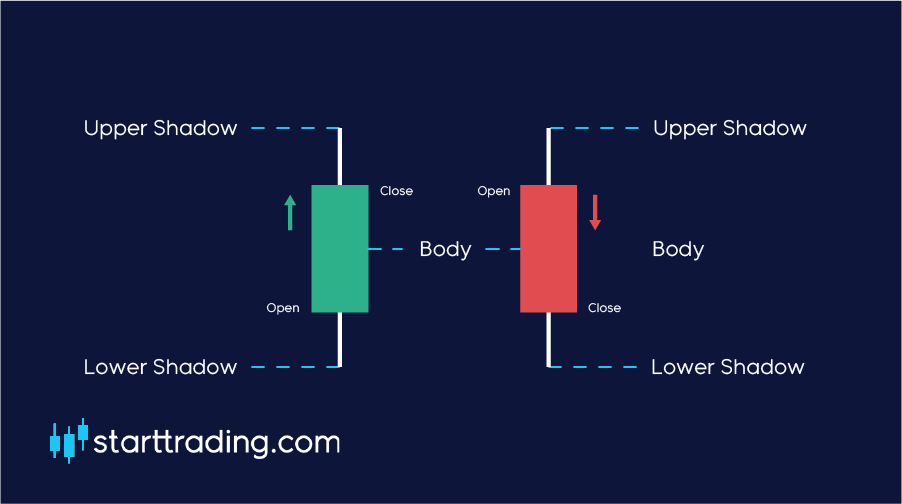
Anatomy of a candle
Each candle can be broken down into several smaller parts, each one giving us some valuable information as to what the price did during that particular period of time.
Here is an image of a labeled candlestick.
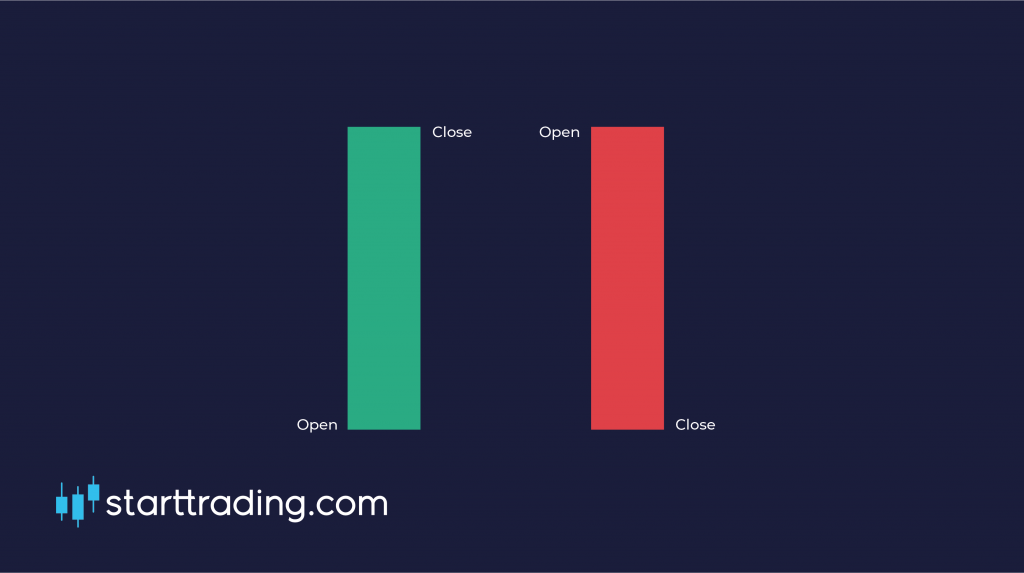
Open
Every candle must start somewhere, this is what we call the open. The open is located where the close was of the previous candle and signifies the starting point of this candle’s given period of time.
Close
This is the exact point at which the candle closed when the set period of time expired.
Body
The body is the area between the open and the open and close points on the candle. This is also referred to as the “real body” of the candle.
- If the close is above the open, that means that the price moved up during the candle formation. This will typically form a white or a green candle.
- If the close is below the open, that means that the price moved down during the candle formation. This will typically form a black or a red candle.
Wicks and shadows
As you can see from the image, there are two lines either side of each candlestick. This signifies the high and low of each candle, or the upper and lower shadows.
This simply displays the high point/low point that the price got to during the candlestick formation.
Bullish
Using the information that we gain by looking at each candlestick we can come to some assumptions about the market sentiment.
There are many ways in which we can do this, but one of the easiest to spot is by looking at the length of the body of the candle and it’s colour.
At its most basic, a green(white) candle is considered to be bullish one, after all, the price has moved up.
If it has a long green body, then we consider this to be a STRONG bullish candle. If it only has a small body then we could consider it to be a WEAK bullish candle – simple stuff.
These bullish candles show us that there were more buyers than sellers during this time period and it also shows us the strength of this buying power. The stronger it is, the larger the candle body.
Bearish
On the other hand, a bearish candle demonstrates when the bears have a hold of the market and are pushing the price down.
If a candle has a red(black) body then it is considered to be a bearish candle. The price is going down.
Again, If the candle has a long body then we would consider this to be a STRONG bearish candle. If the candle only has a short body then we would consider this to be a WEAK bearish candle.
The longer the candle, the more bearish the market is and the more the sellers have overpowered the buyers.
Bullish & bearish (Shadows & wicks)
Similarly to the real bodies of the candles, the shadows and wicks can tell us a lot about how bullish or bearish the market is.
For example, if there is a large wick on the upside this is usually an extremely bearish sign and is what we would typically call a price rejection.
The shadow indicates that the price pushed up to that point but was quickly pushed back down, hence the term rejection.
The same is also true for the opposite scenario. If you find a candle with a large wick to the downside side then this is a downward price rejection and is usually a bullish sign.
The longer the wick, the stronger the rejection is.
Trends & channels
Trend lines
As you may have noticed already, the market does not move in perfect straight lines. It is always fluctuating and oscillating, creating new highs and lows all the while.
It is for this reason that we must learn how to draw trend lines on a chart so that we can have a better chance at predicting where the new support and resistance zones will be.
Trend lines are likely the most common out of all the forms of technical analysis that you will see forex traders use. They are simple but very effective.
The two most common trend lines that we will draw on our chart will be on the uptrends and downtrends that we spot in the market – that way we can more easily visualise the trend.
How to draw a trend line?
Luckily this is pretty simple. All you have to do is find two major tops or two major bottoms in the market and connect the two points. It really is as easy as that.
Here are a couple of examples:
Uptrend
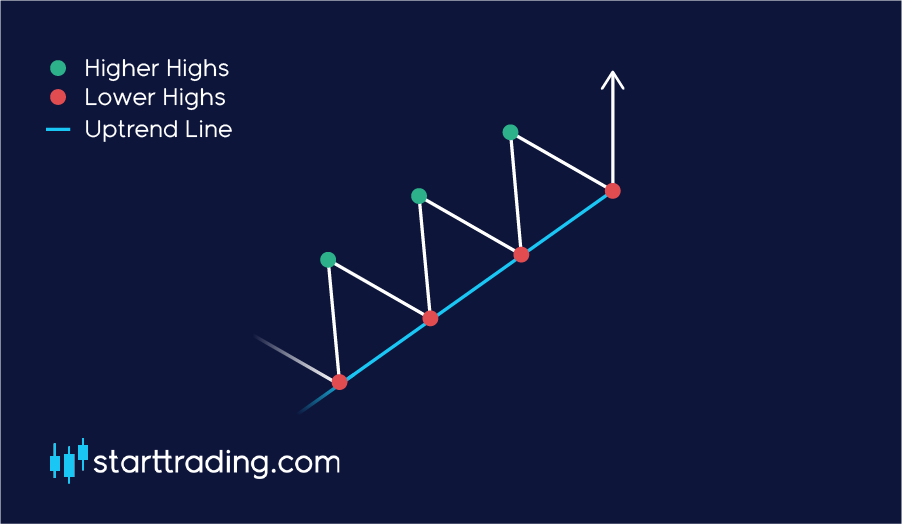
For an uptrend, we draw the trend lines underneath the structure along clear support points that we observe the price to rebound from.
Downtrend
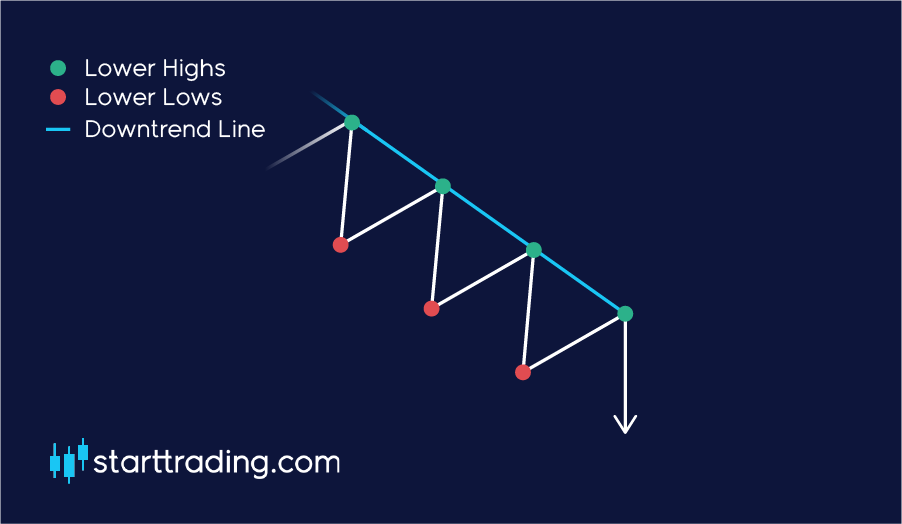
In a downtrend, we draw the trend lines on top of the market structure along the clear resistance points that we observe the price to rebound from.
Not all trend lines are made equal
It is important that you understand the validity of the trend lines that you’re drawing. Just because you have connected two points in the market it doesn’t mean that this will be an obvious point of support or resistance.
In fact, most traders would not consider the trend to be valid until the price hits the trend line at least three times.
Here are some simple rules to keep in mind when assessing the validity of your trend lines:
- The more times that the trend line is tested and successfully holds, the more valid it becomes. Imagine that the line becomes stronger each time it successfully resists the price movements.
- You need two clear tops or bottoms to draw a valid trend line, but this is the weakest possible trend line you can get. It takes at least three to form a valid trend line.
- Horizontal lines are the strongest. The steeper the trend lines become, the less likely the are to hold their level.
TIP: Do not force trend lines onto your chart. Far too often people will draw trend lines to try and support their own theories. These should be OBJECTIVE lines that clearly fit onto the chart. If you’re forcing it, then it almost certainly is not a valid trend line.
The trend is your friend
We have already mentioned this famous cliche once in our course, but it’s worth mentioning again. The trend IS your friend – seriously.
Many novice traders will try to predict moments of market reversals by constantly trade AGAINST the market. As trading is technically a zero sum game, it may seem counterintuitive to “follow the crowd” and trade with the trend but that is exactly what you must do if you are to be successful.
Typically, traders will see that the market is rising and will assume that this cannot and will not continue for much longer. If it is going up, it must come back down. And while that is true, it is exceptionally hard to pick a point of a reversal.
Put it this way, it is extremely difficult to predict a trend in advance when compared to identifying one that is already there.
This often goes against a lot of traders grains, which is potentially why so many people end up losing money in the market.
Experience shows that it is MUCH easier to profit by taking advantage of a current market trend rather than trying to accurately predict a new one. Why make it harder for yourself when you don’t have to?
Channels
When we draw a trend line, we are simply drawing one line on the chart to identify and uptrend or downtrend.
To create a channel, we draw two lines for the same trend, these act as the upper and lower trend lines. These upper and lower trend line signify the market support and resistance zones.
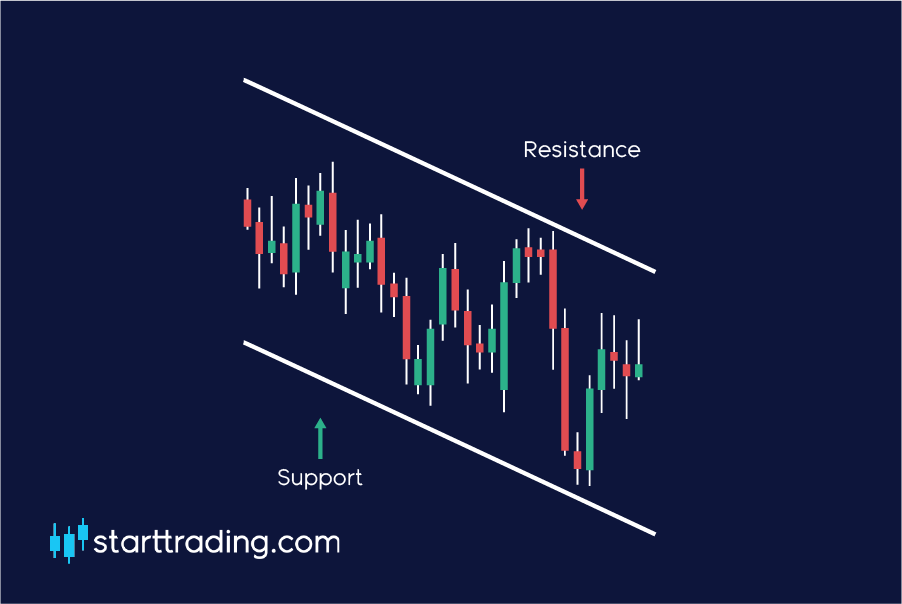
We use channels to gain a better perspective on the market structure and it will usually signify logical points to enter and exit our trades. These can be some of the easiest and most profitable trading situations that you encounter, you just have to be able to spot them accurately.
Note: For a channel to be valid, both of the trend lines must be parallel to each other. Most chart software will have a channel drawing tool to help you do this.
Support & resistance
When it comes to technical analysis, two of the most important and most commonly used terms are without a doubt “support” and “resistance”.
These simple, yet effective ideas are fundamental to many trading strategies and often give us key entry and exit points for our trades.
It is common for most new traders to underestimate or even ignore the importance of support and resistance levels when it comes to technical analysis.
Most newbie traders will be tempted to dive straight into more complicated strategies and will focus their attention towards the advanced indicators such as Fibonacci levels and Bollinger bands, for example.
When they do this, they are missing out on some key information in the market that could drastically improve their bottom line and overall trading success, and the bonus is, it’s all pretty easy to understand.
Support
Okay so let’s start with support. As the name suggests, support is a price point in the market that will usually give the market some stability and act as a support structure for the current price.
It is essentially holding/ supporting the price up to where it currently is. In theory, If it falls back down and hits the support it should be more likely to rebound off it and continue back upwards.
Where would I see a support?
When the price action hits a new low point, or if the price is continually bouncing off of a similar price point when in a downtrend then this will usually be considered support.
This support area normally arises due to an increasing concentration of demand in the market. There are more buyers than there are sellers at the support zone, so naturally, the market is driven back up.
If the market is in a downtrend, it is usually expected for the downtrend to pause and potentially reverse at these support zones.
Note: The more times support/resistances have been tested the stronger it is considered to be.
Resistance
Resistance acts in the exact same way as to support, except that it acts as a ceiling that the price must breakthrough in order to continue its uptrend.
When the price action reaches a resistance point, it is expected to slow down, pause and potentially reverse into a downtrend as the concentration of supply increases and demand reduces.
Where would I see a resistance?
Resistance points are found when the price reaches a new high and then retraces back. This will typically signify a new area of resistance as it failed to break this price point previously.
If the price repeatedly fails at the same point and keeps getting rejected during an uptrend, then we can consider this a resistance too.
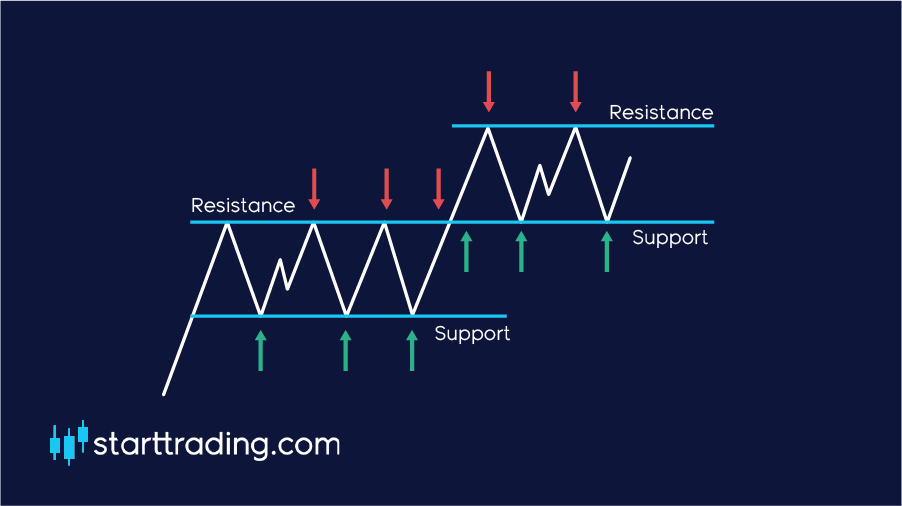
Note: Most traders operate on the premise that each support and resistance zone will not be broken and that it will in fact hold.
Breakout
As shown in the above example the price can move through a support or resistance point, this is called a breakout. The price has pushed through the imaginary obstacle, hence the name breakout.
Old floor, new ceiling & old ceiling, new floor
As the market is always moving, so too are the support and resistance zones. When the market makes new lows and highs, these will become the new support and resistance zones.
The old floor becomes the new ceiling (the old support becomes new resistance)
The old ceiling becomes the new floor (the old resistance becomes new support)
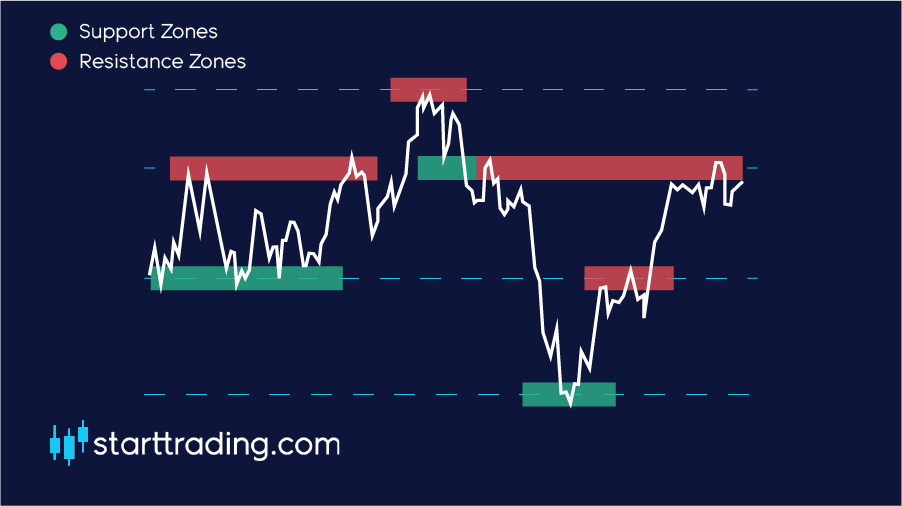
Market psychology
Market psychology plays a huge role in the market movements. In a way, indicators and key market levels such as support and resistance only exist because everybody expects them to exist at the same time.
The vast majority of people place their longs at support zones and people place their shorts at resistances. This makes support and resistances somewhat of a self fulfilling prophecy.
Traders watching the market will remember what has happened in the past and will anticipate future movements based on that information. This is definitely something to keep in mind when you are trading the market yourself.
Some other areas that may act as resistance points include round numbers, intersections with moving averages and trend lines. More on this later.
Trends
As we mentioned several times throughout this course, consistency is key to profitable trading.
The vast majority of this consistency will rely upon your ability to quickly and accurately identify trends and then position your entry and exit points effectively within them. Remember, “the trend is your friend”. It’s cliche, but it’s true.
What is a trend?
Okay, so first things first, we need to define what a trend is before we can spot one.
At its most basic level, a trend is the general direction in which the market is moving
There are typically three main trends in which we would look to identify, an uptrend (bullish), and downtrend (bearish), or a sideways/flat trend.
There is no set time for which a market must be moving for it to be considered a trend, however, the longer a trend remains valid then the more solid and qualified the trend becomes.
How do you identify a trend?
The simplest way of identifying a trend is to pull up the chart and watch the price action of the currency pair.
Price action is shown on most charts in the form of candlesticks. These candlestick display historic price movements of an asset over a given time frame and are plotted on a chart.
This allows us to easily visualise trends and determine what general direction the market is moving in.
For most, if not all of our trading strategies, we will be looking to trade in uptrends or downtrends.
There are certain situations in which you may enter into a sideways market but these are few and far between and have a lot more risk attached. It’s better to stick to clear uptrends and downtrends and enter your positions with more confidence in the direction the trend is moving in.
Let’s break each one down and look at what qualifies as an uptrend or a downtrend.
Uptrend
As I am sure you have already guessed, an uptrend describes the price action of the market when the overall direction is considered to be upwards.
If you can see that the price is clearly moving up over a period of time, then the chances are you are looking at an uptrend in the market.
The fully qualify as an uptrend, each peak and trough of the price action should be higher than the previous peaks and troughs. In other words, we would need to see a series of “higher highs and higher lows”.
As you can see from the example above, the peaks of each movement in the price action are higher than the previous highs. We can also see that each low is higher than the previous low.
This indicates an upward momentum and the market is being pushed higher.
In general, we should be looking for opportunities to go long and try to ride the trend out.
Downtrend
There are no points awarded for guessing what a downtrend is. Yep, a downtrend is what describes the price action when the overall direction is considered to be downwards.
When we see that the price is clearly falling over a given period of time, you will most likely be looking at a downtrend.
In direct contrast to an uptrend, we identify a downward trend by spotting “lower highs and lower lows” in the market.
We are looking for when each trough drops a little lower than the previous low and when each high looks to be weakening when compared to the last high,
This signifies that the market may be running out of steam and we have hit some buyer exhaustion. The market is now bullish and the trend is downward.
In general, we should be looking for opportunities to short the market on this occasion and ride the trend downwards.
Leverage
From what you’ve seen so far in the course, you must be wondering how on earth people manage to make a considerable income trading forex when the values for each pip are so small, especially when we use proper risk management.
People often think that you need vast sums of money and a huge trading capital to begin trading forex, but that is simply untrue. Welcome the wonderful world of leverage trading
Leverage is a tool that allows you to trade with amounts substantially higher than the amount that you have in your trading account by using your account balance as margin. Leverage is expressed as a ratio and is used to show the amount of money you have in your account and how much money you can actually trade.
For example, if you have $1,000 in your account and you have the possibility to leverage 30:1, then your maximum trading balance is $30,000.
Let’s use a real-world example from the property market to show the power of leverage and how it can drastically improve our bottom line.
A real-world example of leverage
Imagine you have £40,000, and you want to buy a property with your money. However, you want to buy something a little more expensive than your current budget allows.
You have your eyes on a £200,000 house and go to the bank to see if they can provide you with a mortgage.
The bank offers you the mortgage as long as you make a 20% down payment of the property value upfront.
This means that you are paying £40,000 in advance and the bank will loan you remaining £160,000.
In this example, you have bought the property using leverage of 5:1.
Fast forward by two years. Your property has increased in value to £300,000. This is an increase of 50%.
Now let’s take a look at the difference between leveraging and not leveraging in this scenario.
Imagine that instead, we bought a £40,000 studio apartment with our money and this also increases in value by 50%. How would our profits compare?
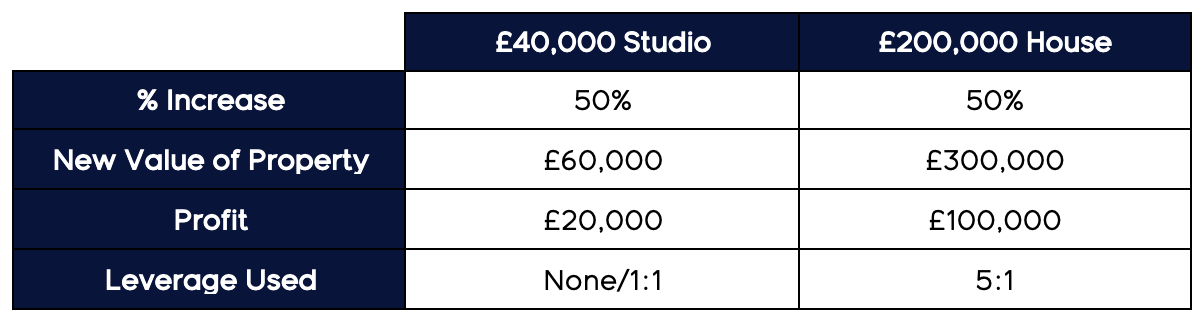
As you can see from the table above, using the same money we have managed to make an extra £80,000 profit by using the power of leverage.
This works in the same way in the forex market.
As with all things in life, there are some pro’s and con’s attached. Let’s take a look at some of the benefits and risks of using leverage in forex trading.
Benefits of leverage
- We can get a higher exposure to the market, which in turn allows us to profit at a much higher rate when our trade wins.
- Low margin requirements.
- Leverage is interest-free. Technically, leverage could be considered a short term, interest-free loan.
Risks of leverage
- Having a higher exposure to the market is a double-edged sword. If we have access to higher profits, it also means we have access to more significant losses.
- When trading at very high leverage, we can run into something called a margin call. This occurs when the value of your margin account falls below the broker’s required threshold. This gives the broker the right to immediately liquidate your portfolio, as well as any current trade trades and effectively wipe out your account.
A margin call can be easily avoided if we always trade sensibly, stick to our stop losses and employ an optimal risk management strategy.
Note: Leverage is not some magic formula that will lead you to make massive profits. It merely magnifies our trading position size and subsequently our gains and losses.
Terminology
When you first hit the markets it likely that you will come across a lot of jargon and unfamiliar terminology that you don’t quite yet understand. Don’t worry, this happens to all of us.
However, it is important that you get to grips with the industry lingo as quickly as possible so that you can understand what is going on in front of you.
Below we will cover the key terms that you need to know before you start forex trading.
Bid and ask
When you look at any of the currency pairs you will always see two different exchange rates at any one given time. This is the bid price and the ask price.
This can often be slightly for new traders, but there is no need to be.
The bid = the highest price that somebody is willing to pay for the currency
The ask = the lowest price that somebody is willing to sell the currency for
Naturally, the bid price is always lower than the asking price as people are trying to get the best value for their trade. However, when these two prices meet in the middle, that is the moment when a transaction occurs.
Note: You may sometimes see the ask price being referred to as the “offer price”, depending on your brokerage.
Spread
The spread is simply the difference between the bid price and the ask price and is usually measured in pips.
It is often a key indicator of the liquidity of the market – the smaller the spread, the more liquid the market is, and vice versa.
For example, the spread on one of the Major currency pairs is typically very low due to its huge trading volume when compared to the spread on a lightly traded Exotic currency pair.
The spread can often widen during times of increased volatility and uncertainty in the market.
This can discourage traders from entering new positions as it becomes more expensive and the likelihood of a profitable trade diminishes as the spread increases.
When we are using a brokerage, the spread is typically the area where they will make their profit.
Here is an example of a bid/ask spread.

From this we can calculate the spread in pips by deducting the ask price from the bid price.
Spread = 13033 pips – 13031 pips = 2 pips
Competition between brokers is fierce. Having a low spread is one of the main fronts that the brokerages compete on. You will often see them quote their low spread prices in their advertisements to try and attract new traders.
The spread quoted in their advertisements is usually for the EUR/USD as this is the most heavily traded pair on the market and therefore tends to have the lowest spread.
This is the main reason for brokers introducing the 5th decimal place as it gives them more opportunity to compete. For example:

Spread = 11174.2 pips – 11173.4 pips = 0.8 pips
Slippage
Slippage is what occurs when you place an order in the market at once price but it eventually executes at a different price.
This is due to low execution speeds and usually occurs during times of high volatility when the price is moving around a lot.
It’s a relatively common thing to happen to you as a trader and there is normally no need for concern. Sometimes you will get slippage in your favour and you will receive a better price, and other times it may go the other way.
If you are trading the Majors and currency pair with a lot of trading volume and considerable market depth, then slippage usually isn’t an issue.
Margin
Margin is what you need in your trading account in order to access leverage. It can sometimes be easier to look at margin as if it were collateral or a deposit for a loan.
In order to access leverage you must have a margin account, which is different to standard brokerage account, however, the vast majority of trading accounts in forex are margin accounts.
If you are trading using a margin account then “margin” is the word used to refer to balance that you have in your account.
Let’s say you want to enter a £1,000 position with a 5:1 leverage
£1,000/5 = £200
In this instance, your required margin would be £200. In other words, you need £200 in your account in order for you to execute this trade.
Account currency
One thing to keep in mind is the currency that your account is kept in. More often than not, this is the currency that you will have loaded your account with originally.
When you are trading pairs that do not include your default account currency then you will usually have to exchange it to the base currency of the currency pair that you are trading. From that point you can execute your trade as normal.
Any profits and losses are typically exchanged back to your account currency, too. This is normally not a problem, however some brokerages may take a small fee for this which may eat into your bottom line over a long period of time.
Understanding Lots
When you first begin trading, one of the most important things that you will need to wrap your head around is the idea of your lot sizes.
When you enter a position in forex, you will be buying in a predetermined number of units, also known as a lot. There are three commonly used lot sizes in forex, these are displayed in the table below.
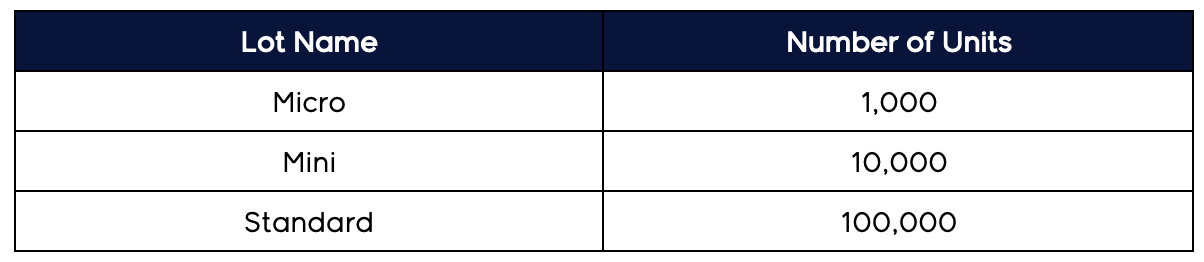
Historically, forex has only ever been traded in these predetermined lot sizes.
Due to the rise in popularity of forex and the increasing competition brokers have begun adding more lot size options and have become much more flexible in order to enhance the trader’s experience. Good news for us!
Choosing your lot size
The best way to look at lot sizes is to think of their value in USD per pip.
Most beginner traders will not start off trading with one lot unless they have a large starting trading capital. However, even if this is the case it is advised to stick to smaller sizes until you learn the ropes.
Luckily, most if not all brokerages will allow you to choose your own lot size so that you can trade freely and set your own levels of risk.
One standard lot (commonly referred to as just “one lot”) is 100,000 units of the base currency. This is typically the benchmark that we will work with for our trades.
If we trade with one lot (100,000 units) then each pip will be worth $10.
Here are some common lot sizes and what one pip value would equate to.
- 5 lot = $50 Per pip
- 2.5 lot = $25 Per pip
- 1.00 lot = $10 Per pip
- 0.10 lot = $1 Per pip
- 0.05 lot = $0.5 Per pip
Why is choosing the correct lot sizes important?
Choosing the correct lot size is vital when it comes to foreign exchange trading. If you want to trade correctly then you must consider your lot size carefully.
The size of the lot you buy directly impacts how much exposure your account has to the market and how market fluctuations will affect your overall account balance.
Too big of a lot size and you will be overexposed, causing your account to be at increased risk.
The larger the lot size, the more that each pip movement will affect your account.
As a beginner trader, it is very easy to overexpose yourself and trade at too high a position size. This is the easiest way to blowing your account and becoming a losing trader.
Trading is a marathon, not a sprint.
Let’s take a look at some pip movements and how our lot size would affect our overall trading account.
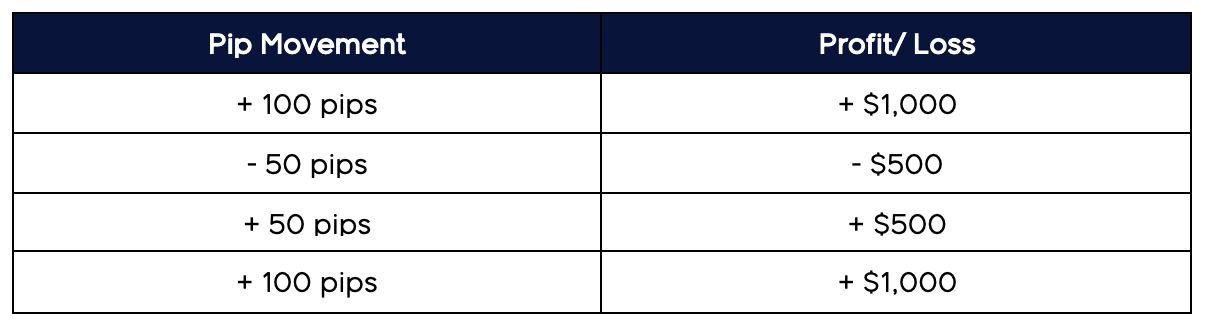
Lot size risk management
Note: Lot size risk management is one of the most vital components of becoming a successful forex trader. We cannot stress this point enough.
Some may even argue that this is the single most important factor in becoming a profitable foreign exchange trader and protecting yourself from blowing your account. Please take your time to thoroughly read and understand this part of the course.
The journey to becoming a successful trader is a difficult one – you will almost certainly make some mistakes along the way. If you stick to the information you learn in this course and manage your risk effectively with optimal lot-sizing then you will be well on your way.
As we mentioned, risk management is there to help you protect you from blowing your account. However, it also protects you from being too cautious.
Even if you have the greatest forex strategy in the world, a poor risk management system will almost certainly end in you trading unprofitably.
With that being said, here are our risk management guidelines.
Lot size recommendations
Luckily, it’s pretty simple to figure out your lot size. Here are the sizes we recommend.
For every $1,000 you can trade with a 0.1 lot size.
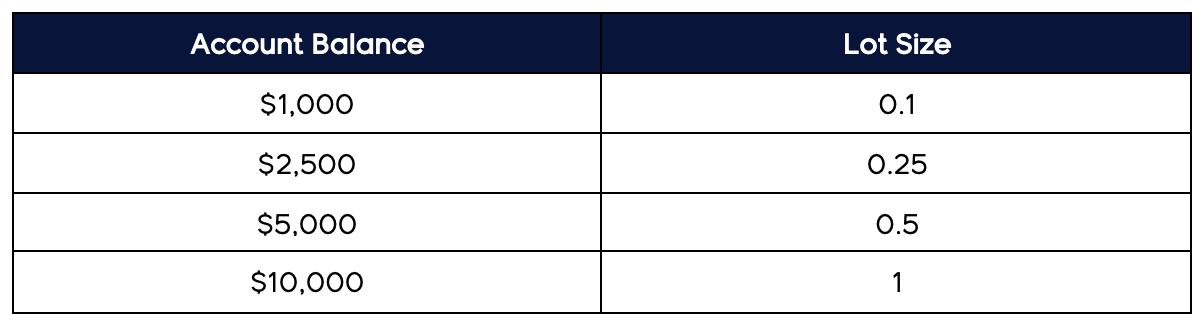
So why do we recommend these levels?
Imagine you have a trading balance of $1,000 and you decide to trade with a 1.0 lot.
We know that a 1.0 lot equates to a pip value of $10 and as we mentioned earlier, the average currency pair can easily move 100 points in one day.
-100 pips x $10 = -$1,000
As you can see, if you open a trade without a stop loss and it goes against you, you could wipe out your entire account in one single day.
If you stick to the recommended lot sizes in the table above then you will drastically reduce the chances of losing your account. The losses that you will inevitably face will become much easier to manage.
For example, with the same $1,000 we would recommend using a 0.1 lot size which has a pip value of $1. Let’s now use the same scenario as before.
-100 pips x $1 = -$100
In the same trade, we have cut the potential loss down by 90%. In order to blow your account, you would now have to lose ten trades in a row which is extremely unlikely, even if you have a poor win rate.
You may already be thinking that even though this minimizes our losses, it also reduces our potential for profit. While this is true, account preservation and protecting your capital is one of the most important skills a trader can learn.
After all, you cannot trade if you don’t have any money in your account.
Tip: Make sure you apply these rules EVERY single time you trade, with no exceptions. It’s a tool that will protect your overall account balance while still giving you enough room to make some nice profit.
We will look at risk management in much greater detail in Unit 5 where we will show you some other strategies and skills that you can use to minimise your risk even further. So, for now, let’s carry on with some of the basic fundamentals of understanding the market.
Understanding Pips
What is a pip?
If you have done any research on forex before or if you have spent some time looking over the markets already then you will surely have come across the term “pip” (sometimes referred to as a “point”).
Note: It’s vital that you understand what a pip is as this will be the fundamental unit that you measure your forex trades in. When we make a trade, we normally target a predetermined number of pips for our entry points and stop losses.
A pip (percentage in point) is the unit of measurement that we use to express the change in value between the currencies in our currency pair.
To be exact, a pip is a standardised unit and is the smallest amount that any currency pair quote can change. Because of this, a pip is usually the last decimal place in a currency pair.
As a rule of thumb, most of the currency pairs in the forex market are quoted to four decimal places. In this instance, the fourth decimal place is the pip, as shown below.

In fact, all of the majors are quoted to four decimal places, except for when the Japanese yen is the quote currency. In those instances, there are only two decimal places, and yeah, you guessed it, the last decimal place is the pip, as shown below.

Pips in action
Let’s take a look at some examples of market movements in terms of their pip value.
Example: one pip move
If the value of the GBP rises against the dollar by one pip then we would see a move like this.
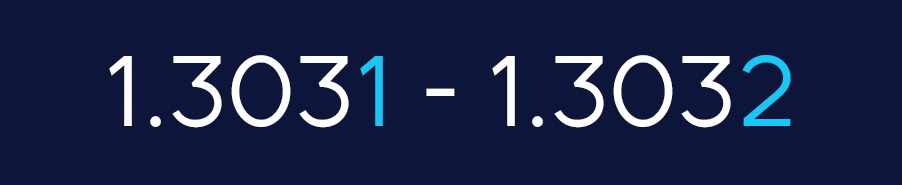
In this example, the value of GBP has risen by 1 pip against USD. If we were longing on this move, we would have made a 1 pip profit.
Example: 100 pip move
If the value of the GBP rises against the dollar by 100 pips then we would see a movie like this.
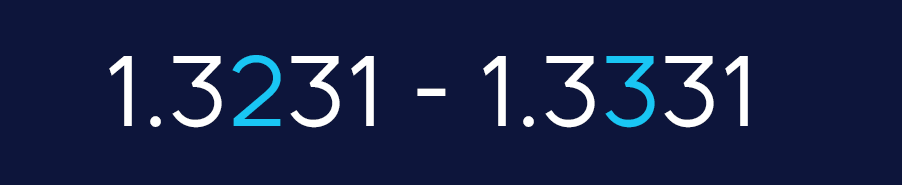
Average pip movement in the market
On average, forex markets usually move anywhere between 80-100 pips per day. Of course, this differs between each market but that is a reasonable average to draw from.
Now, this may not seem like much, and on the grand scheme of things it isn’t, but when we include the use of leverage and margin trading, we can profit quite significantly from these kinds of moves in the market. More on that later in this unit.
Pipettes
If you go on to your brokerage and see that the Yen is trading with three decimal places or if you see GBP/USD trading to 5 decimal places, don’t worry.
As a rule of thumb, if there are five decimal places displayed, then the fourth decimal is the pip. If there are three decimal places, then the second is pip.
In these examples, the 5th and 3rd pips would be what we refer to as pipettes and are not particularly important in terms of our trading strategies.
Trades
Whenever you are trading in any sort of market you will likely come across the terms “going long” and “going short”. But what exactly do they mean?
Buy/ Long
To “go long” in forex is to BUY a currency with the expectation that it’s value will RISE so you can then close your trade for profit. The aim – Buy low, sell high.
Sell/ Short
To “go short” in forex is to SELL a currency with the expectation that its value will FALL so you can then close your trade for a profit. The aim – Sell high, buy low.
How does a trade work?
Whenever we make a trade, we can also call it entering a position. A position is the amount of currency that you own that is subjected to market exposure and thus its value will fluctuate against other currencies in the market.
Important: Every currency trade that we make involves a pair. This means that you will always be going long on one currency while simultaneously going short on the other.
In other words, when we enter a long position, we are hoping that the base currency strengthens against the quote currency.
For example, we buy EUR/USD at 1.114 – This means that we are long on the Euro while simultaneously being short on the US Dollar.
In its essence, we are betting that 1 EUR would be worth more than 1.114 USD at the end of the trade.
This may seem complicated, but this is in fact how all of the trading markets work across the globe. Let’s take an example from the London Stock Exchange.
Let’s say we buy some shares in GlaxoSmithKline(GSK) at £18. This means we are going long on GlaxoSmithKline against GBP – in other words, we are going long on GSK shares while shorting GBP because we feel that the value of the GSK shares will grow in value faster than GBP will.
If this was a forex currency pair we would call it GSK/GBP.
Shorting Explained
While longing is a relatively straightforward concept, people tend to have a harder time understanding the concept behind shorting.
At its most basic level, shorting is the exact opposite of longing, but for the sake of clarity let’s clear it up here.
When you short a currency pair, the base currency is SOLD while the quote currency is bought. This is what gives the simultaneously longing and shorting in every trade.
Example:
Shorting USD/JPY = selling USD and buying JPY.
We are effectively betting that the USD will decrease in value against JPY.
When can you trade Forex?
Unlike Wall Street, the Forex markets are open 24 hours a day, 5 days a week. This provides traders with a huge window of potential trading time to work with, which can be both a blessing and a curse.
Many new traders get hooked to the screen, morning, noon, and night searching for every small edge they can find and entering hundreds of positions each and every day.
While this can be a profitable strategy, it is highly unlikely that it can remain profitable over the long run as you will inevitably run into trading burnout.
As always in life, quality over quantity.
With that being said, the main appeal of forex is its availability and accessibility on a global scale.
No matter where you are in the world you will likely be able to trade the foreign exchange during sociable hours – something which cannot always be said for the other international markets.
Opening hours
The major trading centres for forex around the globe are London, New York, Tokyo, and Sydney. The diversity of these geographical locations is what makes forex a 24-hour market.
Each of the four regions have their own official hours. It is important to be aware of these as it can affect the volume traded and the volatility of the currency associated with that nation’s currency.
Let’s take a look at these four trading centres and their opening times. All times are in GMT (Greenwich Mean Time).
- London – 08:00 – 17:00
- New York – 13:00 – 22:00
- Sydney – 22:00 – 07:00
- Tokyo – 00:00 – 09:00
NOTE: These times vary throughout the year based on daylight savings times.
Forex trading sessions
As you can see from the times above, there are overlaps between the opening hours which is what leads to forex’s 24-hour market. However, not all of the 24 hours in the day are made equal when it comes to forex.
When it comes to trading, it is important to take note of volatility. This what traders thrive off as it means the price is moving around aggressively and thus there are more opportunities to take advantage of.
Each of these opening hours signifies the start of a new trading session. During these official hours, trading the currency associated with each region brings increased volatility and bigger price movements.
Here are the currencies associated with each trading session.
- UK & Europe – British Pound (GBP), Euro (EUR), Swiss Franc (CHF)
- US & Canada – US Dollar (USD), Candian Dollar (CAD)
- Australasia – Australian Dollar (AUD), New Zealand Dollar (NZD)
- Japan – Japanese Yen (JPY)
When is the best time to trade Forex?
Forex prime time is typically thought to be between 13:00-17:00.
This is considered to be the best time of the day trade the foreign markets as this is when five of the major currencies are all being actively traded simultaneously – GBP, EUR, CHF, USD, and CAD.
When there is more activity there is more volatility which provides a greater number of profitable trading opportunities that we can take advantage of.
TIP: The first hour of each new trading session usually brings the highest volatility as traders will be scrambling to react to out of hours events.
Currency Types
When we talk about currencies, we can break them down into three main categories; Major, Minor and the Exotics.
Let’s look at some examples in each category and dive a little deeper into what each category means.
Majors
As we have defined several times in this course so far, there are seven major currencies in Forex. For clarity, these are:
- USD
- GBP
- EUR
- JPY
- AUD
- CAD
- CHF
Some people also include New Zealand Dollar (NZD) in this list, too.
As you know from earlier in the course, we only trade forex using currency pairs.
A major currency pair is any of the major currencies paired with the US Dollar. For example, GBP/USD, EUR/USD or USD/JPY
As USD cannot be paired with itself, we only have six major currency pairs, or seven if you include the NZD.
You will find that all of these pairs benefit from near-constant liquidity due to their high levels of trade with the U.S. A lot of the money you will see on the market will be from importers and exporters as well as speculators and investors.
Minors
Minors are any two of the major currencies listed above (that are NOT USD) paired with each other. For example, GBP/EUR or GBP/JPY.
Here is where the liquidity starts to drop off, but you can still find substantially liquid and busy markets in the minors. Look for countries that regularly trade with each other for the most liquid markets. Minors such as GBP/EUR, AUD/JPY and GBP/CAD.
There will be others with far less liquidity as the countries may have no real trading relationship.
Exotics
As you may have guessed, exotics are any of the currencies that aren’t listed above. The Exotic currencies are always traded in a pair with Major currency.
Typically, most of the exotic pairs have low volume, a large spread and can be extremely volatile due to their lack of market depth – but that is the very reason why a lot of people enjoy trading them.
However, there are still plenty of Exotics that are widely traded and have high trading volumes. These are usually the larger economies that do plenty of international trade.
Here are some of the most popular Exotic currencies:
- Norwegian Krone (NOK)
- Brazilian Real (BRL)
- Mexican Peso (MXN)
- Singapore Dollar (SGD)
- Indian Rupee (INR)
- Chinese Yuan (CNY)
- Turkish Lira (TRY)
- South Korean Won (KRW)
- South African Rand (ZAR)
- Danish Krone (DKK)
Forex may be the only place where you would get away with calling Norway and Denmark exotic!
Currency correlations
When trading forex, it is vital that we are aware of something called currency correlation. This is the relationship between two or more currency pairs, and how when one pair moves it usually signifies a move in the other currency pair.
However, it does NOT always mean that the correlated currency pair will move in the same direction.
We have three types of currency correction, these are:
Perfect positive currency correlation
This signifies that every time the currency pair moves, the second pair will move in the SAME direction 100% of the time.
Perfect negative currency correlation
This signifies that every time the currency pair moves, the second pair will move in the OPPOSITE direction 100% of the time.
Zero currency correlation
This signifies that there is NO correlation between the two currency pairs and that the movements between them are totally random.
What does this mean for our trading?
- More knowledge means that we have a higher likelihood of being able to develop more profitable trading strategies as a result.
- In Forex, it is entirely plausible to trade positions that effectively cancel each other out. If two currency pairs have a negative correlation with one another, then their moves will directly counteract one another, and it will leave you at a loss.
- Can be used to show how much risk we are exposed to. If we have several currency pairs trading at the same time and they all have high positive correlations, then we will be overexposed and often doubling or even tripling our risk.
- You can effectively hedge and manage your existing positions.
Currency Pairs that typically have a positive correlation (SAME direction)
- EUR/USD and GBP/USD
- EUR/USD and AUD/USD
- USD/CHF and USD/JPY
Currency Pairs that typically have a negative correlation (OPPOSITE direction)
- EUR/USD and USD/CHF
- GBP/USD and USD/JPY
- GBP/USD and USD/CHF
NOTE: Currency correlations change. Do not take these for gospel. It’s important to be vigilant when trading, never assume that these numbers will remain the same forever.
Correlated Commodities
One important thing to bear in mind is how certain currencies can be heavily correlated with commodities.
Some country’s economies rely heavily on exports of a certain commodity, so if they particular industry takes a hit then you can pretty safely assume that the currency will follow in the same direction, and vice versa.
Two famous examples of this are:
- AUD and Gold
- CAD and Crude Oil
Knowing which currency is tied with what commodity can give traders an advantage and can help you understand why the market moves the way that it does.
Understanding currency
Trading is all about information. The more of it you have, the more informed your decision is on where the market is going to move and thus the higher the likelihood that your trade will be a successful one.
It’s worth taking a bit of time to go over the main forex country profiles so you can understand how they may react to news and events that occur while you are trading.
Here is a quick overview of the main currencies nations/regions and what to look out for.
United Kingdom
Central Bank – The Bank of England
Currency – Great British Pound (GBP)
London is the biggest Forex trading centre in the world and accounts for around 35% of the worldwide trading volume – impressive stuff. That suggests that the market will be most active during UK trading hours, which are between 08:00-17:00 GMT.
One thing to keep an eye on is the interest rates set by the Bank of England. As London is such a huge global centre for trading, these rate fluctuations and monetary policy changes can send huge shockwaves through the whole market.
United States of America
Central Bank – The Federal Reserve
Currency – U.S Dollar (USD)
The USD is part of an estimated 87% of all currency trades.
That is truly staggering when you consider that the foreign exchange market accounts for $5 trillion of trading volume, per day.
New York is the main trading centre in the USA and is the second-largest in the world after London. It is for this reason that you should always pay close attention to the New York session and be aware of what is going on in the US news – if you are trading the US Dollar.
Aside from looking for interest rate changes and monetary policy updates, one thing to pay attention to is the New York Stock Exchange (NYSE). This is heavily correlated to the price of the US Dollar.
The Eurozone
Central Bank – European Central Bank
Currency – Euro (EUR)
At the time of writing, the Euro is the official currency for 19 out of 28 EU member countries. This makes the Euro one of the biggest and most widely used currencies in the world.
Even now there are still many countries seeking membership to the EU and wanting to use the Euro as their main currency. One of the main benefits of the Euro is that the European Central Bank (ECB) must balance the needs of all of the member nations.
This avoids problems arising from the individual political instability of nations and makes it less likely that the Euro will be manipulated or deliberately inflated for the gain of one particular country.
It is for this reason that the Euro is typically less volatile than some currencies, but not always.
Switzerland
Central Bank – Swiss National Bank
Currency – Swiss Franc (CHF)
Despite it being located right in the middle of Europe, Switzerland is not a part of the European Union. A country notorious for its neutrality, Switzerland is one of the richest countries in the world.
As you would expect, their main trade is with their fellow European countries, namely Germany, France, and the U.K. They also do considerable trade with the USA.
Watch for the price of gold – a quarter of Switzerland’s cash is backed with gold reserves, so the prices are heavily correlated with the price of gold (XAU/USD).
Canada
Central Bank – Bank of Canada
Currency – Canadian Dollar (CAD)
Canada is reported to have the 10th largest economy in the world, which is not bad for a country of 38 million people. As you would expect, the US and Canada have strong ties, with Canada exporting 70% of their goods to their neighbour.
Canada is a massive exporter of crude oil, so as you would expect, the CAD’s movements is heavily tied to any price changes or events in the crude oil industry. Keep an eye on this, especially if you are trading USD/CAD.
Australia
Central Bank – Reserve Bank of Australia
Currency – Australian Dollar (AUD)
The AUD offers one of the highest interest rates out of all the main currencies. It is for this reason than the AUD is often used as part of currency carry trades, which is where traders try to take advantage of interest rate differences between currencies.
The main premise of a currency carry trade is to sell a currency with a low-interest rate and then use those same funds to buy a currency, such as the AUD, that has a higher interest rate. This is usually done with leverage.
The AUD is a typically stable currency, with the central bank aiming to keep inflation at 2%. The AUD is heavily tied to gold as it is one of the biggest exporters of gold in the world.
Japan
Central Bank – Bank of Japan
Currency – Japanese Yen (JPY)
A true powerhouse, Japan is ranked at number three out of the world’s largest economies.
As the Yen is known to offer typically low-interest rates, it is often used in currency carry trades. This makes it especially important to pay attention to the Bank of Japan’s monetary policies and interest rate updates.
There is plenty of volumes traded on the Yen, so you will never be short of liquidity. In fact, the USD/JPY is the 2nd most traded currency pair in the world.
It would be best to keep in mind how China’s economy is performing as China is one of Japan’s largest trading partners.
What is a currency pair?
Okay, time to bust some jargon and take it down to the basics. When you look at the tickers on any Forex website or brokerage, you will see currencies in pairs.
They look like this:
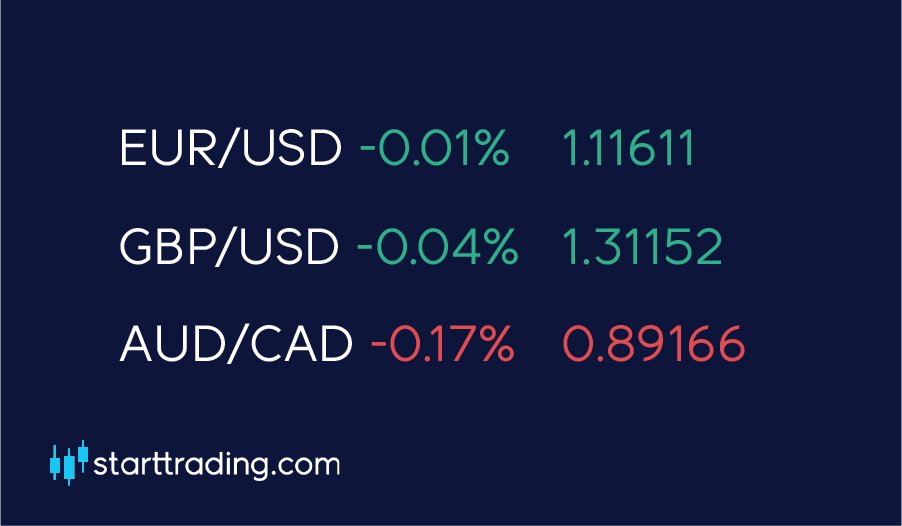
Let’s take GBP/USD from this example. As we can see – GBP/USD is trading at 1.31152. In simpler terms, all that this is telling us is how much of the second currency we can buy with the first currency.
In this instance, £1 will buy you $1.311.
Now let’s say that the market strengthens due to some good news coming out about UK employment statistics. The pound strengthens. The rate now goes up to 1.36.
This means £1 will now buy you $1.36 – simple stuff!
The first currency in the pair is referred to as the QUOTE currency, with the second being the BASE currency.

Understanding the market
What moves the price and why?
Being the largest financial market in the world, Forex presents many opportunities for traders looking to make profits on the price fluctuations that occur each day. This is done by simply selling your currency for higher than your buy price if you are buying, and vice versa if you are selling.
The key to success in trading is consistency. It is vital that traders can routinely forecast market movements with high accuracy and post winning trades whilst keeping losses to a minimum.
This plays down to one major factor, market understanding. If we know how and why the market moves, then we can more easily predict these movements and eventually profit from them.
Supply and demand
Like all markets, forex is at the mercy of simple supply and demand economics. If there are more people buying a currency then there are selling, then that currency is in demand and the price should rise.
Conversely, if there are more people selling than there are buying, then the currency has a lower demand and the price should fall.
Note: This is with the assumption that supply remains the same throughout.
Let’s break this down even further.
What is driving demand?
Demand for a currency can be driven by the perceived prospects for the currency’s nation as a whole. This is, of course, an extremely complicated set of factors that are very hard to break down, however, there are two main areas of focus.
One of them being the political landscape of the country at present and the other being the conditions of their economy.
In general, if these factors are considered to be positive, then demand will increase. If they are negative, then demand will fall. There are many factors that can come into play here, and some currencies are more sensitive to political news while others to economic.
As a very general rule of thumb, the most popular currencies with the highest trading volumes are more sensitive to economic data than the political landscape. This is due to the fact that the nations of these currencies are usually quite stable and would not be too affected by political news. Of course, this is not always the case.
What causes currencies to fluctuate?
As we touched upon, there are many things that may cause the market to fluctuate. Here are the main areas that
Interest Rate Changes
One of the biggest factors affecting the forex market is interest rate changes that are made by the central banks, specifically the eight global central banks. When these banks change their interest rates, it can lead to sudden and very volatile price changes.
Generally, central banks will raise their interest rates in an attempt to stifle the inflation of their currency. On the other hand, they will normally cut rates to try and stimulate their economy and by encouraging banks to lend.
If an interest rate in one currency is higher than in another, then that usually generates demand. The higher the interest rate, the higher the rate of return is and the higher the profit.
Economic and Political News
As mentioned earlier, the economic and political news can be huge factors in driving demand.
Some of the main factors influencing price include; the consumer price index (CPI), retail sales, quantitative easing, gross domestic product (GDP), and employment rates.
These are all big indicators to the health of a countries economy and its stability.
Trader/Market Sentiment
When it all boils down to it, it is really the institutional investors and traders that will move the price most heavily. Sometimes, all the political and economic news can suggest that the market will move in one direction yet the price does the opposite.
While this is unlikely, it is by no means rare.
As we will touch upon heavily in this course, there are many technical indicators that present buy and sell signals that a lot of traders will be reacting to. This creates massive intraday trading opportunities for short term scalps and profitable day trading positions.
In these short term instances, the political and economic landscape of the currency’s country does not hold as much weight – in other words, the macroeconomics become less important. When we look at shorter time frames, it is better to have one eye on the fundamentals while paying closer attention to the market trends, support and resistance, moving averages and other technical indicators that can help determine the future price movements.
As this course goes on, we will go into much greater detail on these topics and will discuss technical analysis in Units 3 and 4.
How to trade Forex?
Simply put, when you trade forex, you are buying one currency and selling another.
This always happens simultaneously, when you buy one, you are immediately selling another. This is the reason why currencies are always quoted in pairs.
Here are the top 5 forex currency pairs based on their trading volume:
- Euro/Dollar (EUR/ USD)
- Dollar/Japanese Yen (USD/ JPY)
- British Pound Sterling/US Dollar (GBP/ USD)
- US Dollar/Swiss Franc (USD/ CHF)
- Australian Dollar/US Dollar (AUD/ USD)
Currency pairs will always rise and fall against each other for a varying number of reasons.
For example, if there is a particular political turmoil in one country, then the value of their currency may plummet – think GBP after Brexit was announced.
Forex produces price fluctuations each and every day in a wide number of currency pairs. These price movements are usually caused due to either fundamental or technical reasons, but we will go into these in much detail later on in the course.
It is these fluctuations that give traders opportunities to make a profit by correctly forecasting the direction that the price changes will move in.
What do you need to trade forex?
The beauty of the forex markets is that anybody can trade them. All you need is an internet connection, a device and enough cash to open up an account (this depends on the website or broker that you decide to use).
You can register a trading account with as little as $10 in most cases. However, as with anything, the more you put in the more you get out.
What is Forex?
For those of you who are complete newbies to Forex trading and are trying to learn the ropes, it can often be an overwhelming and daunting world, but it doesn’t have to be.
To put it very simply, Forex, otherwise known as foreign exchange (FX), is simply the practice of exchanging one currency for another.
Have you ever been on a trip abroad and had to swap your Dollars (USD) for Euro (EUR)? Or how about exchanging your British Pounds (GBP) for Australian Dollars (AUD)? If you answered yes, then guess what?
You’ve already had your first experience as a Forex trader, although it’s pretty likely that you didn’t make any money in this trade.
The Forex market that you are here to learn how to trade is made up of a huge decentralized trading network that allows you to trade currencies from all over the world. And when we say huge, we mean enormous.
The Forex market has a daily trading volume of just over $5 trillion USD. This is pretty staggering when you compare it with the stock exchange market that has around $250 billion USD of daily trading volume.
This makes Forex the largest and most liquid trading market in the entire world, so the opportunity to make profits are aplenty! One of the main reasons why it is so popular is due to it being open for business 24 hours a day, 5 days a week.
Don’t worry you don’t have to be glued to your screen all day. The market is closed over the weekend which gives you time to take some rest, reflect on your past trades and step away from the charts for a little while.
Who trades Forex?
Central banks are a very big player in this space as they must try to regulate and control the price fluctuations of their own currency.
The central bank’s decision making, such as their interest rate policies, can bring huge price swings and fluctuations in the market. Their main aim is to stabilize inflation and to stimulate their own economy via the Forex markets and their currencies market value.
Commercial and investment banks are also huge players in foreign exchange. They have their own trading desks where they try to capitalize on price fluctuations and they also hedge their own portfolios.
Corporations are also heavily involved in Forex markets. When they conduct business on a global scale, companies will typically import and export with countries using different currencies than their own.
This means that when they pay for goods and services they must use foreign exchange to do so.
And then there is the retail trader. Psst, that’s us!
There are many different strategies that individual investors employ when trading Forex, but the main objective is typically to gain a profit by correctly forecasting market movements and price fluctuations.
Something to bear in mind – there is a big difference between who trades Forex and who successfully trades Forex, this is particularly true for retail traders. With the aid of this course, we will hopefully be turning you into the latter.
Why trade Forex?
Forex is the biggest trading market in the world in terms of daily trading volume – and by some distance, too. Being the largest market in the world, there is almost always liquidity on a wide range of currency pairs, giving traders almost limitless opportunities to profit.
This liquidity means that you can trade with confidence, knowing that you will always be able to buy and sell your chosen currency pair with ease.
This high liquidity also means it is much harder for market prices to be manipulated and it also benefits traders with very low transaction costs.
The other reason Forex is so popular is that you can trade it 24 hours a day, 5 days a week. It’s one of the most openly available markets in the world.
This allows traders the opportunity to fit their trading around their full time or part-time jobs, unlike the stock exchange where their working hours would likely overlap.
Combining all of these factors together, it gives people the opportunity to make money from wherever they are in the world. It can help people to secure their financial freedom and gives them opportunities that they would not normally have access to.
As long as you have the drive, the will, and the determination, anybody can become successful in the Forex markets – and with the help of this course, we can take you there.
Introduction
Welcome to the starttrading.com forex mastery fast track program, designed for people of all ages and experience levels to learn how to trade forex in a fun and interactive way.
If you want to develop a deeper understanding of the forex markets and learn from industry experts how you can earn an income from trading the currency markets, then you have come to the right place. You will develop all the necessary skills and strategies you need to help you trade the forex markets consistently and successfully and learn how to create another source of income for yourself.
In this course, we will guide you through the basics, all the way to advanced understanding. So that you can finally hit the markets yourself – fully equipped with the tools you need to succeed and secure your own financial freedom.
However, it is important to keep in mind that this is not a get rich quick scheme! In fact, it is quite the opposite. In order to be a successful forex trader, you must have the right skills, but you must also have the right mindset and a whole lot of discipline.
This is not for the faint-hearted, so bring your A-game and aim for consistency if you want to make it as a forex trader. We recommend that you open up a free $2,500 practice trading account for the purpose of this course so that you can supplement the theory with some first-hand trading experience, risk-free.
Sign up for your free $2,500 practice trading account here.
You can also go to tradingview.com and open up a free account and have a play around with the interface and get familiar with the indicators we will be discussing in this course, but more on that later!
So, without further ado, let’s get to it