The relative strength index, or more commonly referred to as RSI is another momentum indicator that we use in technical analysis that measures the strength in the recent changes of price.
It is an extremely popular tool, you will have likely come across other traders using this tool and often you can find traders having this as one of their only indicators.
It is relatively simple to comprehend and it gives some fairly simple signals to follow when incorporating it into your trading arsenal.
What is RSI?
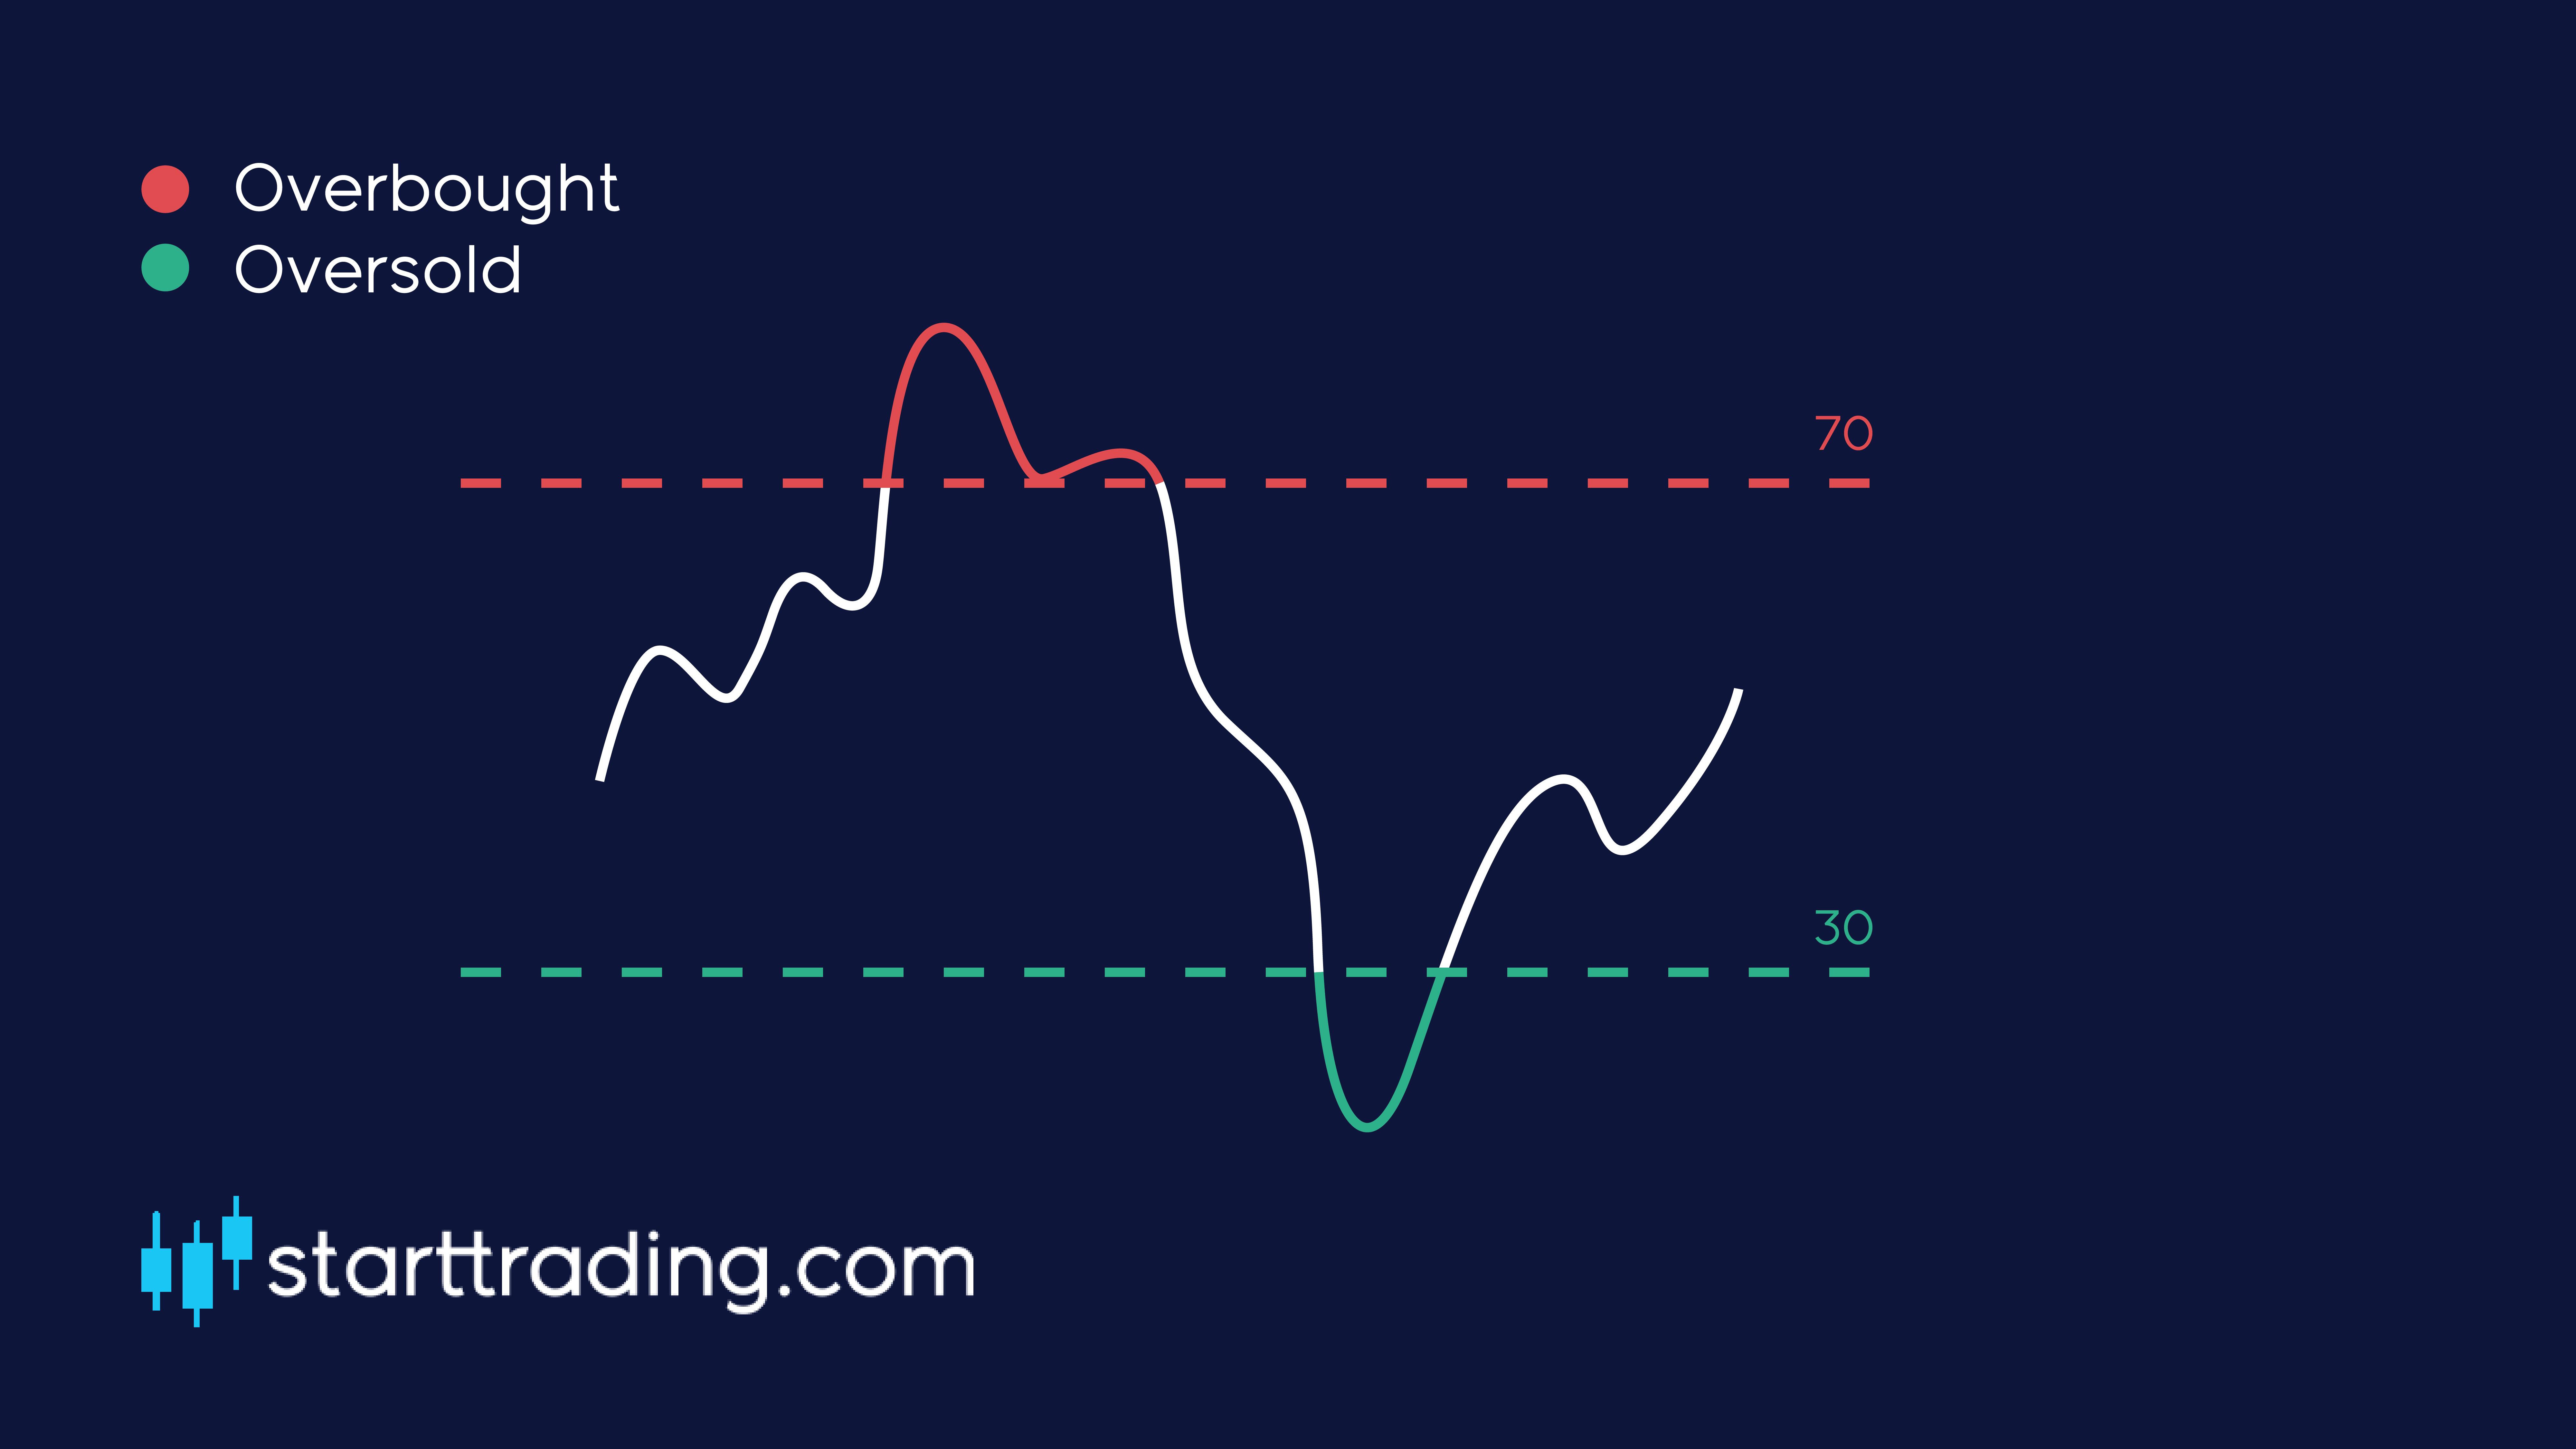
The RSI is depicted as an oscillator on our trading chart and has a value from 0 – 100 and will look something like this on your chart.

The blue line that you can see on the indicator represents the RSI and what level the market is currently trading at.
The RSI will rise when the number and the size of positive closes increases, and it will fall as the number and the size of negative closes increase. As mentioned, the RSI can only fall somewhere between 0-100, however, there are two very important levels to keep an eye on when it comes to picking up trading signals.
Oversold
As you can see from the graphic above, we have two dotted lines displaying “oversold” and “overbought”.
Typically, when the RSI falls to 30 or below, the market is considered to be oversold. The more oversold the market becomes, the higher the likelihood that the market will rebound and the price will strengthen.
Overbought
The opposite is true for when the market is starting to run out of steam. When the RSI rises above 70, this is considered to be in overbought conditions and the market will be more likely to fall back down.
The higher the RSI goes, the more likely the market will lose strength. What goes up most come down at some point.
Trading signals
RSI is a great tool for recognising when market reversals may be ready to happen. If the market reaches overbought or oversold conditions you should look for other indicators to give you confluent reasons to enter a position.
For example, if you see that the market is about to hit a support at the same time that the RSI hits 30 and is now oversold, that would be a great time to open up a long position.