What Are Moving Averages? Moving Averages Explained
The moving average is one of the most commonly used technical indicators, and for good reason. They are relatively simple concepts to grasp and they give us a simple view of the market trends and the recent price history.
Share:
So what is a moving average?
A moving average is simply a line on our chart that signifies the closing price of each candle over a specific period of time.
You will notice that the charts we view can often seem chaotic with wild price fluctuations which make the graphs somewhat hard to read. Moving averages help to make sense of this by creating a smooth line that shows the historical price action.
The main purpose of a moving average is to be able to more easily identify trends and to spot reversals as they are happening.
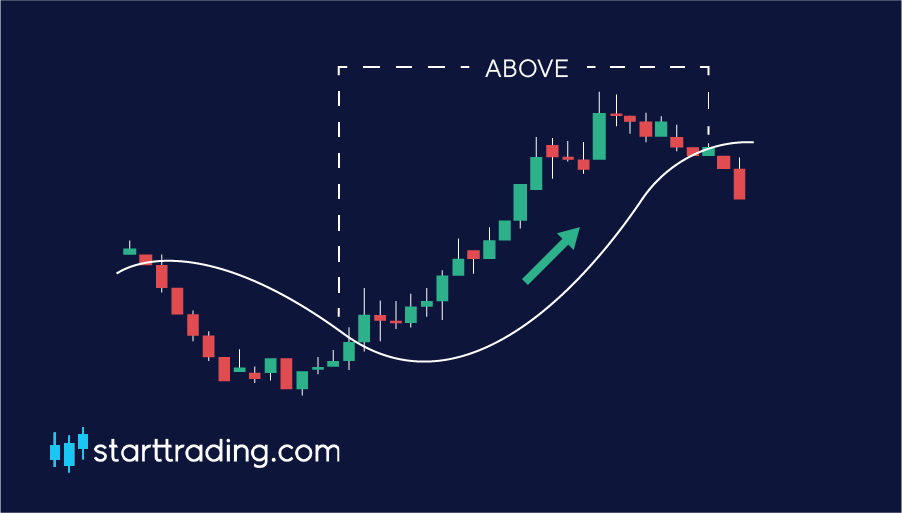
When the price of the currency pair is shown to be above the moving average, this is considered to be an uptrend.
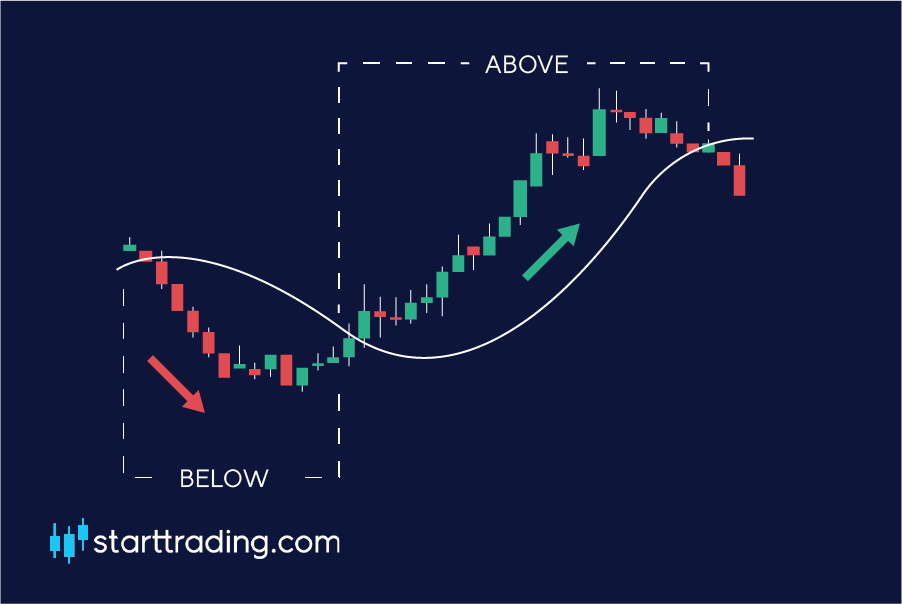
On the other hand, when the price is shown to be below the moving average, this is considered to be a downtrend.
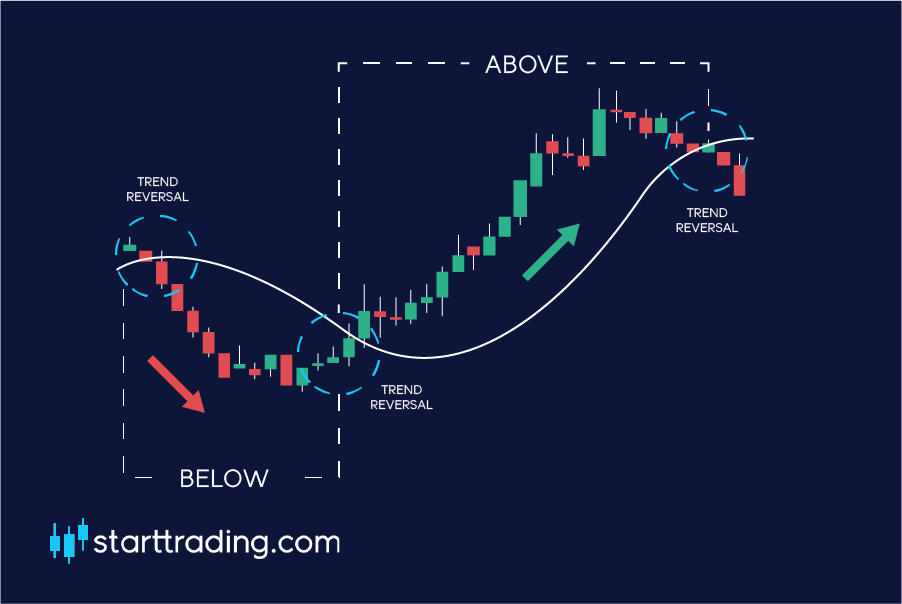
When the trend line is broken, we would consider this to be a trend reversal.
Note: Moving averages are based on past prices and are known as lagging indicators. This means that the information they are displaying to you has already happened. They can not predict when a trend reversal will happen, they can only confirm it once it has happened.
There are a few different types of moving average that we can use in our trading arsenal. The main two that we will consider in this course are the simple moving average (SMA) and the exponential moving average (EMA). Let’s break each one down in more detail.
Simple moving average
Let’s say that we are using a 5-day SMA for our chart. This means that our moving average line will represent the average closing price of the previous five days.
For example, if the closing price over the last 5 days were $1.63, $1.65, $1.70, $1.67, $1.62 our calculation would look like this:
($1.63 + $1.65 + $1.70 + $1.67 + $1.62) / 5 = $1.65. So in this case, our 5-day SMA would be at $1.65.
The longer the period of time that the SMA covers, the less reactive it is to current price changes and fluctuations in the market.
As each of the price points has equal weighting, the most recent price action effects the market just the same as the last price point the SMA uses in its calculation.
This can be problematic to traders as it means that the SMA is slower to react to rapid price movements that may prove to be important.
Exponential moving average
This is where the exponential moving average (EMA) comes in. The EMA gives more weight to the recent price movements which in turn makes it more reactive to the recent events in the market.
This can be beneficial to a lot of traders as trend reversals can be spotted more quickly as the more reactive EMA will display shifts in sentiment over the SMA.
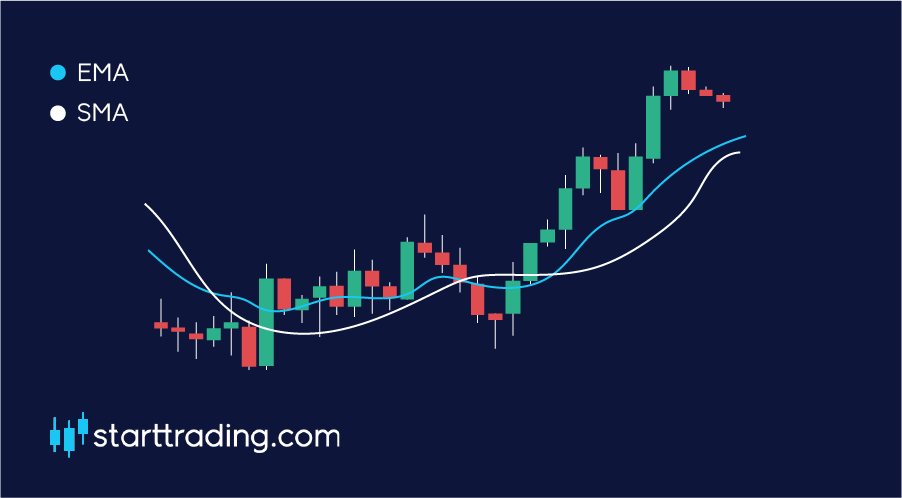
Due to this, when you look at a chart with both the SMA and EMA visible at the same time, you can see that the EMA is closer to the actual price and is more volatile than its counterpart.
When trading, it is much more important to be able to visualise what is going on right NOW with the price action rather than what was happening in the market previously.
Length of the moving average
The period of time that the moving average covers will make a significant difference to its position on each chart. That’s why most traders utilise multiple MA’s at the same time. Here are some of the most commonly used:
10-20 – Short term trends
50 – Mid term trends
200 – Long term trends
How to trade with moving averages
Moving averages act a lot like support and resistance lines. As many traders are using them at the same time, they are often met with a reaction when the price nears these points. Keep this in mind when doing your analysis.
Look for a bounce or a breakout of these points and then enter your positions accordingly.
As a rule of thumb, when the price is below the MA it will act as resistance for the price to break through. Conversely, when the price is above the MA it will act as a support.
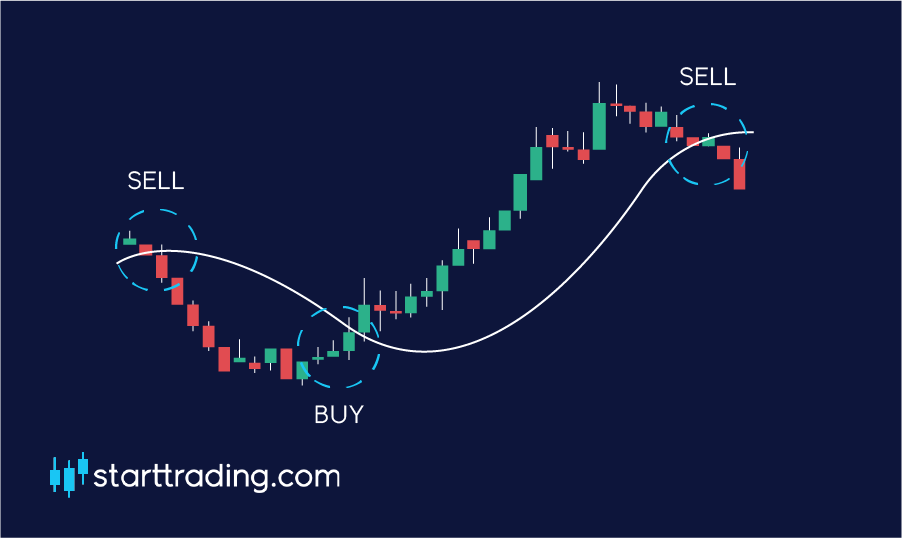
Because of this, when the price has successfully crossed up and over the moving average line, this would be considered to be a buy signal.
On the flip side, when the price crossed the moving average line to the downside then this would be considered a sell signal.
Next Steps
To conclude starttrading.com make learning to trade easier, you don’t have to start trading alone. Take your trading to the right level, simply sign up to our FREE online trading course so that we can give you the help you need today!
Share: