Lesson Tag: Paid Membership
Trends & channels
Trend lines
As you may have noticed already, the market does not move in perfect straight lines. It is always fluctuating and oscillating, creating new highs and lows all the while.
It is for this reason that we must learn how to draw trend lines on a chart so that we can have a better chance at predicting where the new support and resistance zones will be.
Trend lines are likely the most common out of all the forms of technical analysis that you will see forex traders use. They are simple but very effective.
The two most common trend lines that we will draw on our chart will be on the uptrends and downtrends that we spot in the market – that way we can more easily visualise the trend.
How to draw a trend line?
Luckily this is pretty simple. All you have to do is find two major tops or two major bottoms in the market and connect the two points. It really is as easy as that.
Here are a couple of examples:
Uptrend
For an uptrend, we draw the trend lines underneath the structure along clear support points that we observe the price to rebound from.
Downtrend
In a downtrend, we draw the trend lines on top of the market structure along the clear resistance points that we observe the price to rebound from.
Not all trend lines are made equal
It is important that you understand the validity of the trend lines that you’re drawing. Just because you have connected two points in the market it doesn’t mean that this will be an obvious point of support or resistance.
In fact, most traders would not consider the trend to be valid until the price hits the trend line at least three times.
Here are some simple rules to keep in mind when assessing the validity of your trend lines:
- The more times that the trend line is tested and successfully holds, the more valid it becomes. Imagine that the line becomes stronger each time it successfully resists the price movements.
- You need two clear tops or bottoms to draw a valid trend line, but this is the weakest possible trend line you can get. It takes at least three to form a valid trend line.
- Horizontal lines are the strongest. The steeper the trend lines become, the less likely the are to hold their level.
TIP: Do not force trend lines onto your chart. Far too often people will draw trend lines to try and support their own theories. These should be OBJECTIVE lines that clearly fit onto the chart. If you’re forcing it, then it almost certainly is not a valid trend line.
The trend is your friend
We have already mentioned this famous cliche once in our course, but it’s worth mentioning again. The trend IS your friend – seriously.
Many novice traders will try to predict moments of market reversals by constantly trade AGAINST the market. As trading is technically a zero sum game, it may seem counterintuitive to “follow the crowd” and trade with the trend but that is exactly what you must do if you are to be successful.
Typically, traders will see that the market is rising and will assume that this cannot and will not continue for much longer. If it is going up, it must come back down. And while that is true, it is exceptionally hard to pick a point of a reversal.
Put it this way, it is extremely difficult to predict a trend in advance when compared to identifying one that is already there.
This often goes against a lot of traders grains, which is potentially why so many people end up losing money in the market.
Experience shows that it is MUCH easier to profit by taking advantage of a current market trend rather than trying to accurately predict a new one. Why make it harder for yourself when you don’t have to?
Channels
When we draw a trend line, we are simply drawing one line on the chart to identify and uptrend or downtrend.
To create a channel, we draw two lines for the same trend, these act as the upper and lower trend lines. These upper and lower trend line signify the market support and resistance zones.
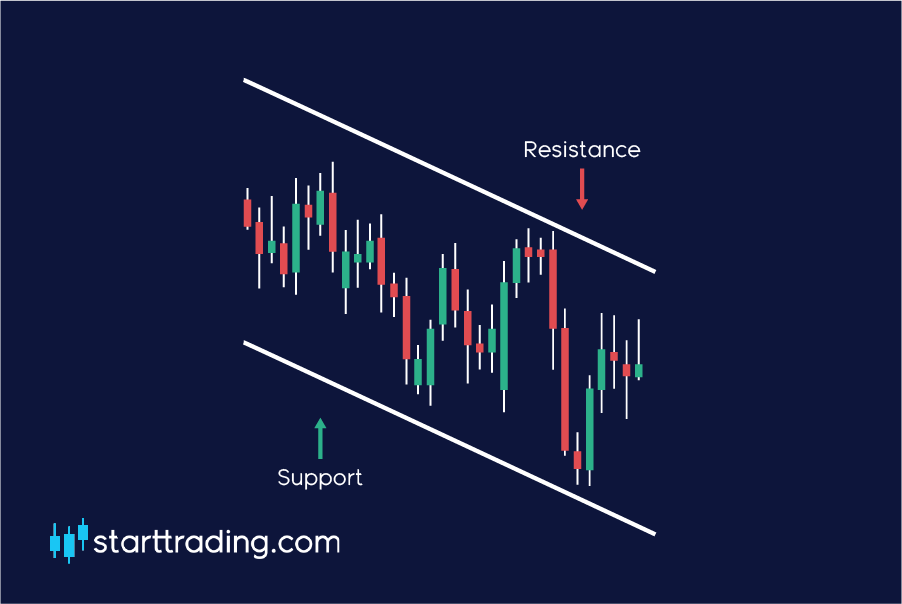
We use channels to gain a better perspective on the market structure and it will usually signify logical points to enter and exit our trades. These can be some of the easiest and most profitable trading situations that you encounter, you just have to be able to spot them accurately.
Note: For a channel to be valid, both of the trend lines must be parallel to each other. Most chart software will have a channel drawing tool to help you do this.
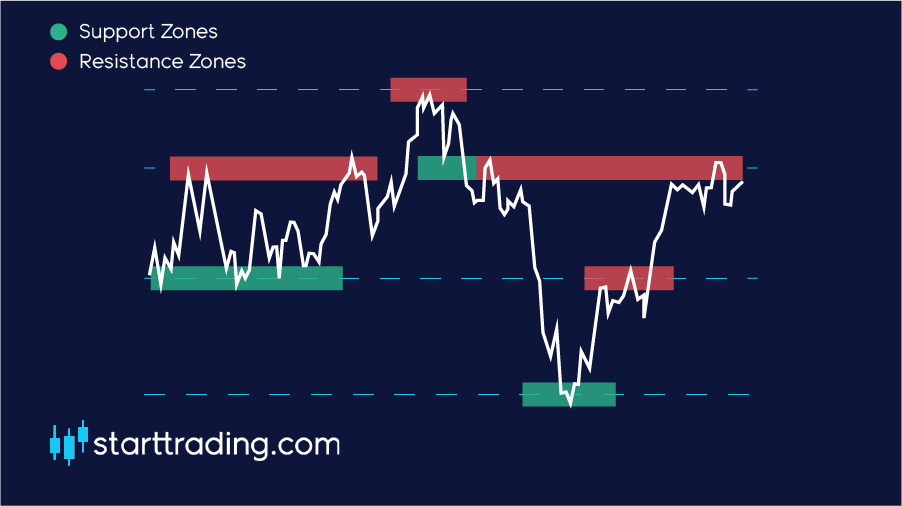
Support & resistance
When it comes to technical analysis, two of the most important and most commonly used terms are without a doubt “support” and “resistance”.
These simple, yet effective ideas are fundamental to many trading strategies and often give us key entry and exit points for our trades.
It is common for most new traders to underestimate or even ignore the importance of support and resistance levels when it comes to technical analysis.
Most newbie traders will be tempted to dive straight into more complicated strategies and will focus their attention towards the advanced indicators such as Fibonacci levels and Bollinger bands, for example.
When they do this, they are missing out on some key information in the market that could drastically improve their bottom line and overall trading success, and the bonus is, it’s all pretty easy to understand.
Support
Okay so let’s start with support. As the name suggests, support is a price point in the market that will usually give the market some stability and act as a support structure for the current price.
It is essentially holding/ supporting the price up to where it currently is. In theory, If it falls back down and hits the support it should be more likely to rebound off it and continue back upwards.
Where would I see a support?
When the price action hits a new low point, or if the price is continually bouncing off of a similar price point when in a downtrend then this will usually be considered support.
This support area normally arises due to an increasing concentration of demand in the market. There are more buyers than there are sellers at the support zone, so naturally, the market is driven back up.
If the market is in a downtrend, it is usually expected for the downtrend to pause and potentially reverse at these support zones.
Note: The more times support/resistances have been tested the stronger it is considered to be.
Resistance
Resistance acts in the exact same way as to support, except that it acts as a ceiling that the price must breakthrough in order to continue its uptrend.
When the price action reaches a resistance point, it is expected to slow down, pause and potentially reverse into a downtrend as the concentration of supply increases and demand reduces.
Where would I see a resistance?
Resistance points are found when the price reaches a new high and then retraces back. This will typically signify a new area of resistance as it failed to break this price point previously.
If the price repeatedly fails at the same point and keeps getting rejected during an uptrend, then we can consider this a resistance too.
Note: Most traders operate on the premise that each support and resistance zone will not be broken and that it will in fact hold.
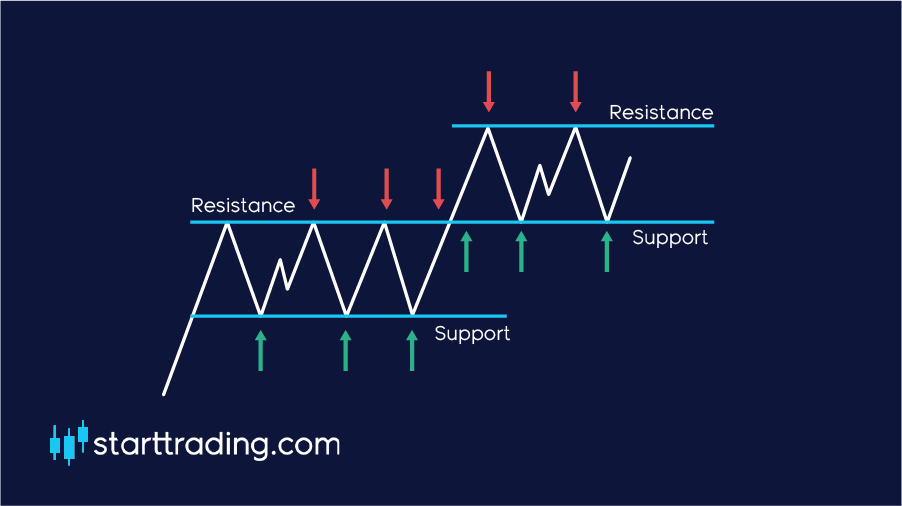
Breakout
As shown in the above example the price can move through a support or resistance point, this is called a breakout. The price has pushed through the imaginary obstacle, hence the name breakout.
Old floor, new ceiling & old ceiling, new floor
As the market is always moving, so too are the support and resistance zones. When the market makes new lows and highs, these will become the new support and resistance zones.
The old floor becomes the new ceiling (the old support becomes new resistance)
The old ceiling becomes the new floor (the old resistance becomes new support)
Market psychology
Market psychology plays a huge role in the market movements. In a way, indicators and key market levels such as support and resistance only exist because everybody expects them to exist at the same time.
The vast majority of people place their longs at support zones and people place their shorts at resistances. This makes support and resistances somewhat of a self fulfilling prophecy.
Traders watching the market will remember what has happened in the past and will anticipate future movements based on that information. This is definitely something to keep in mind when you are trading the market yourself.
Some other areas that may act as resistance points include round numbers, intersections with moving averages and trend lines. More on this later.
Trends
As we mentioned several times throughout this course, consistency is key to profitable trading.
The vast majority of this consistency will rely upon your ability to quickly and accurately identify trends and then position your entry and exit points effectively within them. Remember, “the trend is your friend”. It’s cliche, but it’s true.
What is a trend?
Okay, so first things first, we need to define what a trend is before we can spot one.
At its most basic level, a trend is the general direction in which the market is moving
There are typically three main trends in which we would look to identify, an uptrend (bullish), and downtrend (bearish), or a sideways/flat trend.
There is no set time for which a market must be moving for it to be considered a trend, however, the longer a trend remains valid then the more solid and qualified the trend becomes.
How do you identify a trend?
The simplest way of identifying a trend is to pull up the chart and watch the price action of the currency pair.
Price action is shown on most charts in the form of candlesticks. These candlestick display historic price movements of an asset over a given time frame and are plotted on a chart.
This allows us to easily visualise trends and determine what general direction the market is moving in.
For most, if not all of our trading strategies, we will be looking to trade in uptrends or downtrends.
There are certain situations in which you may enter into a sideways market but these are few and far between and have a lot more risk attached. It’s better to stick to clear uptrends and downtrends and enter your positions with more confidence in the direction the trend is moving in.
Let’s break each one down and look at what qualifies as an uptrend or a downtrend.
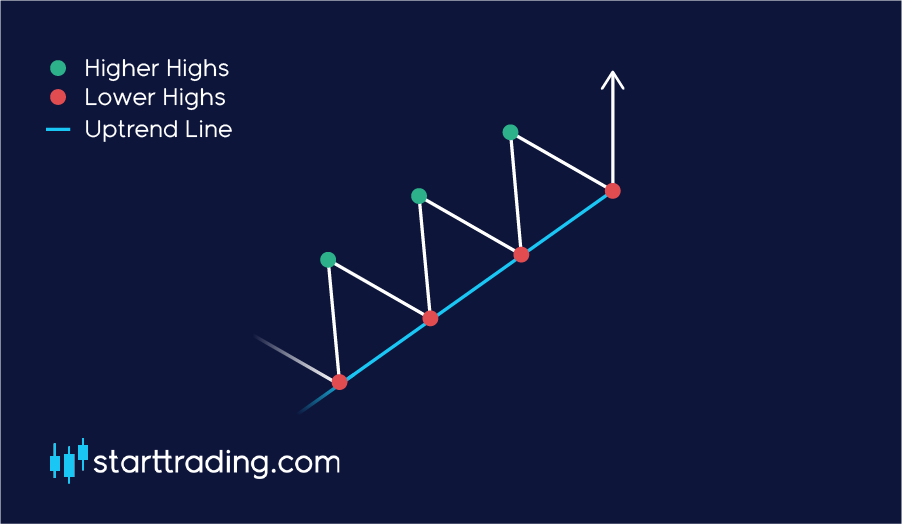
Uptrend
As I am sure you have already guessed, an uptrend describes the price action of the market when the overall direction is considered to be upwards.
If you can see that the price is clearly moving up over a period of time, then the chances are you are looking at an uptrend in the market.
The fully qualify as an uptrend, each peak and trough of the price action should be higher than the previous peaks and troughs. In other words, we would need to see a series of “higher highs and higher lows”.
As you can see from the example above, the peaks of each movement in the price action are higher than the previous highs. We can also see that each low is higher than the previous low.
This indicates an upward momentum and the market is being pushed higher.
In general, we should be looking for opportunities to go long and try to ride the trend out.
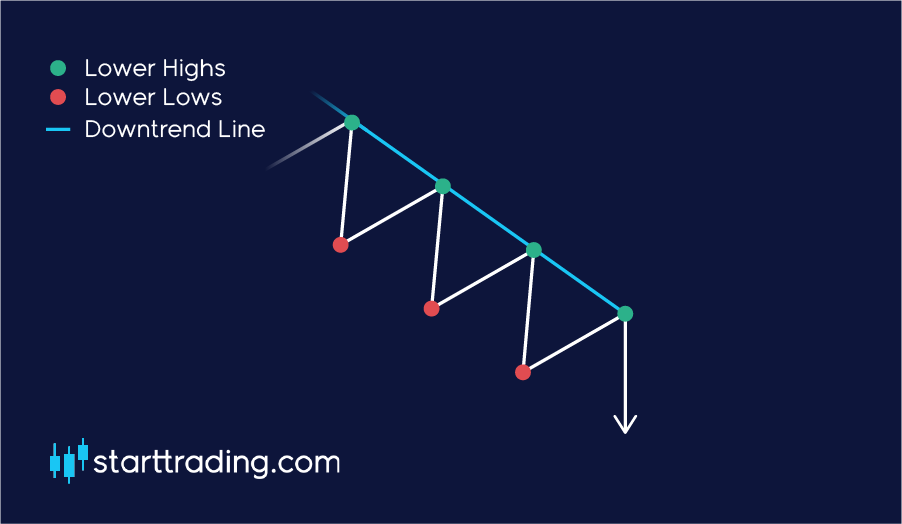
Downtrend
There are no points awarded for guessing what a downtrend is. Yep, a downtrend is what describes the price action when the overall direction is considered to be downwards.
When we see that the price is clearly falling over a given period of time, you will most likely be looking at a downtrend.
In direct contrast to an uptrend, we identify a downward trend by spotting “lower highs and lower lows” in the market.
We are looking for when each trough drops a little lower than the previous low and when each high looks to be weakening when compared to the last high,
This signifies that the market may be running out of steam and we have hit some buyer exhaustion. The market is now bullish and the trend is downward.
In general, we should be looking for opportunities to short the market on this occasion and ride the trend downwards.
Leverage
From what you’ve seen so far in the course, you must be wondering how on earth people manage to make a considerable income trading forex when the values for each pip are so small, especially when we use proper risk management.
People often think that you need vast sums of money and a huge trading capital to begin trading forex, but that is simply untrue. Welcome the wonderful world of leverage trading
Leverage is a tool that allows you to trade with amounts substantially higher than the amount that you have in your trading account by using your account balance as margin. Leverage is expressed as a ratio and is used to show the amount of money you have in your account and how much money you can actually trade.
For example, if you have $1,000 in your account and you have the possibility to leverage 30:1, then your maximum trading balance is $30,000.
Let’s use a real-world example from the property market to show the power of leverage and how it can drastically improve our bottom line.
A real-world example of leverage
Imagine you have £40,000, and you want to buy a property with your money. However, you want to buy something a little more expensive than your current budget allows.
You have your eyes on a £200,000 house and go to the bank to see if they can provide you with a mortgage.
The bank offers you the mortgage as long as you make a 20% down payment of the property value upfront.
This means that you are paying £40,000 in advance and the bank will loan you remaining £160,000.
In this example, you have bought the property using leverage of 5:1.
Fast forward by two years. Your property has increased in value to £300,000. This is an increase of 50%.
Now let’s take a look at the difference between leveraging and not leveraging in this scenario.
Imagine that instead, we bought a £40,000 studio apartment with our money and this also increases in value by 50%. How would our profits compare?
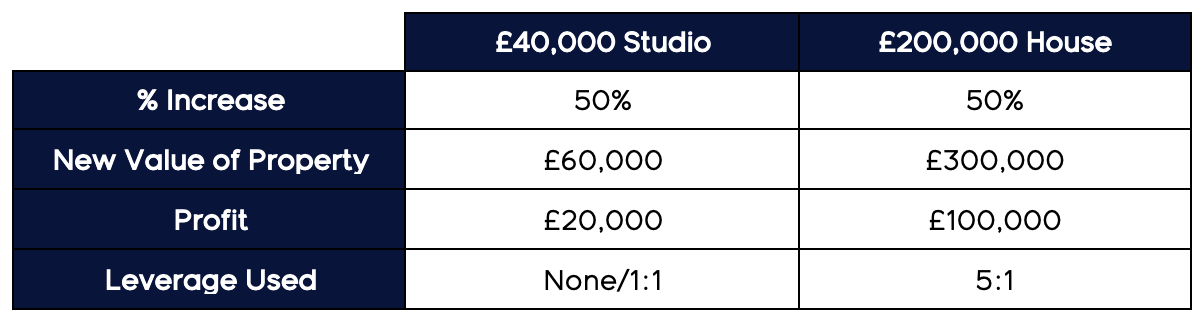
As you can see from the table above, using the same money we have managed to make an extra £80,000 profit by using the power of leverage.
This works in the same way in the forex market.
As with all things in life, there are some pro’s and con’s attached. Let’s take a look at some of the benefits and risks of using leverage in forex trading.
Benefits of leverage
- We can get a higher exposure to the market, which in turn allows us to profit at a much higher rate when our trade wins.
- Low margin requirements.
- Leverage is interest-free. Technically, leverage could be considered a short term, interest-free loan.
Risks of leverage
- Having a higher exposure to the market is a double-edged sword. If we have access to higher profits, it also means we have access to more significant losses.
- When trading at very high leverage, we can run into something called a margin call. This occurs when the value of your margin account falls below the broker’s required threshold. This gives the broker the right to immediately liquidate your portfolio, as well as any current trade trades and effectively wipe out your account.
A margin call can be easily avoided if we always trade sensibly, stick to our stop losses and employ an optimal risk management strategy.
Note: Leverage is not some magic formula that will lead you to make massive profits. It merely magnifies our trading position size and subsequently our gains and losses.
Terminology
When you first hit the markets it likely that you will come across a lot of jargon and unfamiliar terminology that you don’t quite yet understand. Don’t worry, this happens to all of us.
However, it is important that you get to grips with the industry lingo as quickly as possible so that you can understand what is going on in front of you.
Below we will cover the key terms that you need to know before you start forex trading.
Bid and ask
When you look at any of the currency pairs you will always see two different exchange rates at any one given time. This is the bid price and the ask price.
This can often be slightly for new traders, but there is no need to be.
The bid = the highest price that somebody is willing to pay for the currency
The ask = the lowest price that somebody is willing to sell the currency for
Naturally, the bid price is always lower than the asking price as people are trying to get the best value for their trade. However, when these two prices meet in the middle, that is the moment when a transaction occurs.
Note: You may sometimes see the ask price being referred to as the “offer price”, depending on your brokerage.
Spread
The spread is simply the difference between the bid price and the ask price and is usually measured in pips.
It is often a key indicator of the liquidity of the market – the smaller the spread, the more liquid the market is, and vice versa.
For example, the spread on one of the Major currency pairs is typically very low due to its huge trading volume when compared to the spread on a lightly traded Exotic currency pair.
The spread can often widen during times of increased volatility and uncertainty in the market.
This can discourage traders from entering new positions as it becomes more expensive and the likelihood of a profitable trade diminishes as the spread increases.
When we are using a brokerage, the spread is typically the area where they will make their profit.
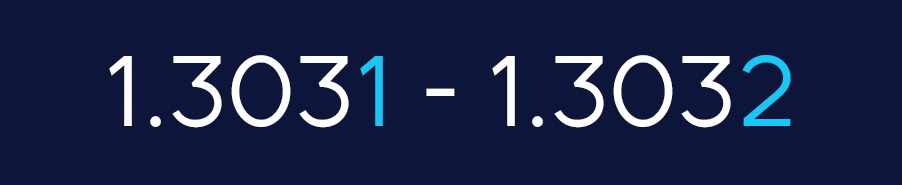
Here is an example of a bid/ask spread.

From this we can calculate the spread in pips by deducting the ask price from the bid price.
Spread = 13033 pips – 13031 pips = 2 pips
Competition between brokers is fierce. Having a low spread is one of the main fronts that the brokerages compete on. You will often see them quote their low spread prices in their advertisements to try and attract new traders.
The spread quoted in their advertisements is usually for the EUR/USD as this is the most heavily traded pair on the market and therefore tends to have the lowest spread.
This is the main reason for brokers introducing the 5th decimal place as it gives them more opportunity to compete. For example:

Spread = 11174.2 pips – 11173.4 pips = 0.8 pips
Slippage
Slippage is what occurs when you place an order in the market at once price but it eventually executes at a different price.
This is due to low execution speeds and usually occurs during times of high volatility when the price is moving around a lot.
It’s a relatively common thing to happen to you as a trader and there is normally no need for concern. Sometimes you will get slippage in your favour and you will receive a better price, and other times it may go the other way.
If you are trading the Majors and currency pair with a lot of trading volume and considerable market depth, then slippage usually isn’t an issue.
Margin
Margin is what you need in your trading account in order to access leverage. It can sometimes be easier to look at margin as if it were collateral or a deposit for a loan.
In order to access leverage you must have a margin account, which is different to standard brokerage account, however, the vast majority of trading accounts in forex are margin accounts.
If you are trading using a margin account then “margin” is the word used to refer to balance that you have in your account.
Let’s say you want to enter a £1,000 position with a 5:1 leverage
£1,000/5 = £200
In this instance, your required margin would be £200. In other words, you need £200 in your account in order for you to execute this trade.
Account currency
One thing to keep in mind is the currency that your account is kept in. More often than not, this is the currency that you will have loaded your account with originally.
When you are trading pairs that do not include your default account currency then you will usually have to exchange it to the base currency of the currency pair that you are trading. From that point you can execute your trade as normal.
Any profits and losses are typically exchanged back to your account currency, too. This is normally not a problem, however some brokerages may take a small fee for this which may eat into your bottom line over a long period of time.
Understanding Lots
When you first begin trading, one of the most important things that you will need to wrap your head around is the idea of your lot sizes.
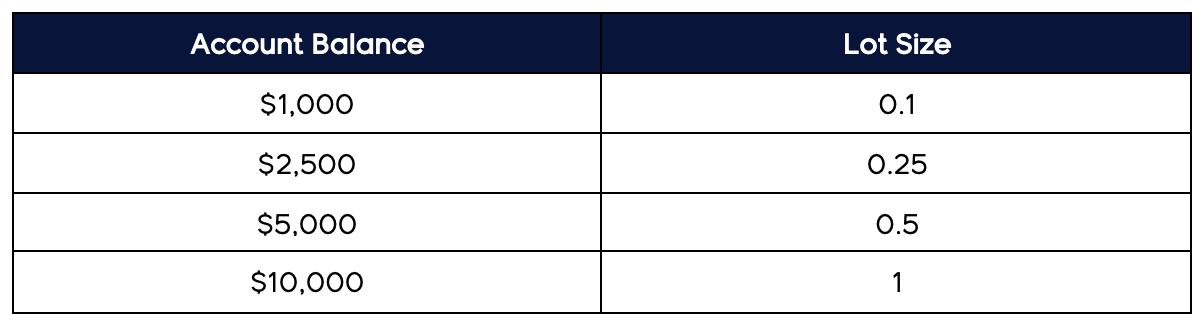
When you enter a position in forex, you will be buying in a predetermined number of units, also known as a lot. There are three commonly used lot sizes in forex, these are displayed in the table below.
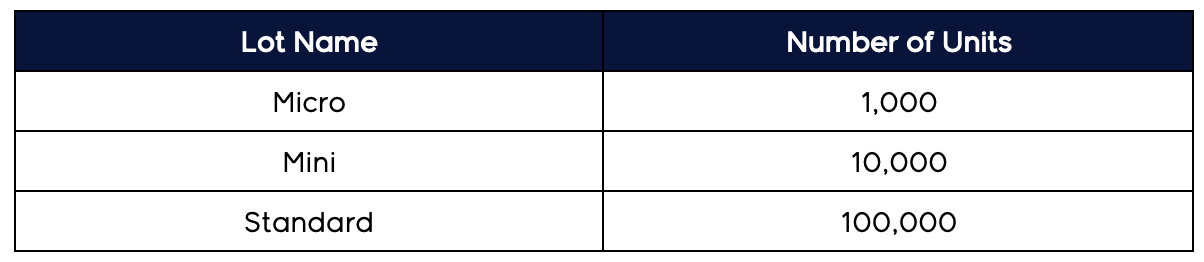
Historically, forex has only ever been traded in these predetermined lot sizes.
Due to the rise in popularity of forex and the increasing competition brokers have begun adding more lot size options and have become much more flexible in order to enhance the trader’s experience. Good news for us!
Choosing your lot size
The best way to look at lot sizes is to think of their value in USD per pip.
Most beginner traders will not start off trading with one lot unless they have a large starting trading capital. However, even if this is the case it is advised to stick to smaller sizes until you learn the ropes.
Luckily, most if not all brokerages will allow you to choose your own lot size so that you can trade freely and set your own levels of risk.
One standard lot (commonly referred to as just “one lot”) is 100,000 units of the base currency. This is typically the benchmark that we will work with for our trades.
If we trade with one lot (100,000 units) then each pip will be worth $10.
Here are some common lot sizes and what one pip value would equate to.
- 5 lot = $50 Per pip
- 2.5 lot = $25 Per pip
- 1.00 lot = $10 Per pip
- 0.10 lot = $1 Per pip
- 0.05 lot = $0.5 Per pip
Why is choosing the correct lot sizes important?
Choosing the correct lot size is vital when it comes to foreign exchange trading. If you want to trade correctly then you must consider your lot size carefully.
The size of the lot you buy directly impacts how much exposure your account has to the market and how market fluctuations will affect your overall account balance.
Too big of a lot size and you will be overexposed, causing your account to be at increased risk.
The larger the lot size, the more that each pip movement will affect your account.
As a beginner trader, it is very easy to overexpose yourself and trade at too high a position size. This is the easiest way to blowing your account and becoming a losing trader.
Trading is a marathon, not a sprint.
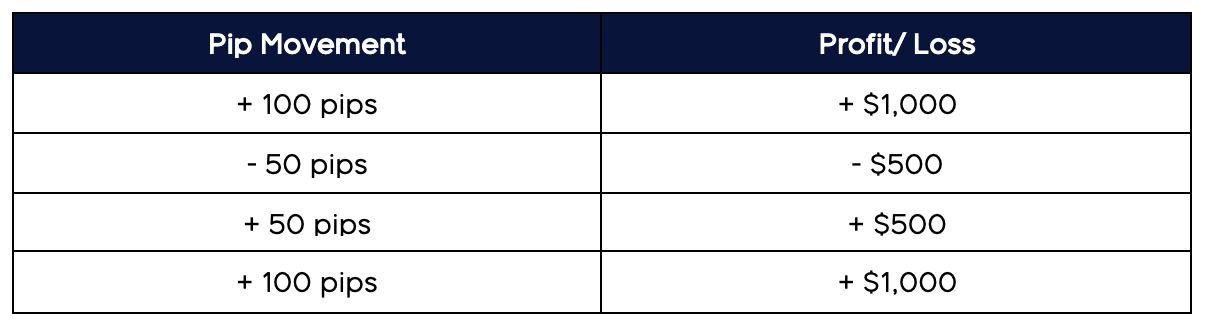
Let’s take a look at some pip movements and how our lot size would affect our overall trading account.
Lot size risk management
Note: Lot size risk management is one of the most vital components of becoming a successful forex trader. We cannot stress this point enough.
Some may even argue that this is the single most important factor in becoming a profitable foreign exchange trader and protecting yourself from blowing your account. Please take your time to thoroughly read and understand this part of the course.
The journey to becoming a successful trader is a difficult one – you will almost certainly make some mistakes along the way. If you stick to the information you learn in this course and manage your risk effectively with optimal lot-sizing then you will be well on your way.
As we mentioned, risk management is there to help you protect you from blowing your account. However, it also protects you from being too cautious.
Even if you have the greatest forex strategy in the world, a poor risk management system will almost certainly end in you trading unprofitably.
With that being said, here are our risk management guidelines.
Lot size recommendations
Luckily, it’s pretty simple to figure out your lot size. Here are the sizes we recommend.
For every $1,000 you can trade with a 0.1 lot size.
So why do we recommend these levels?
Imagine you have a trading balance of $1,000 and you decide to trade with a 1.0 lot.
We know that a 1.0 lot equates to a pip value of $10 and as we mentioned earlier, the average currency pair can easily move 100 points in one day.
-100 pips x $10 = -$1,000
As you can see, if you open a trade without a stop loss and it goes against you, you could wipe out your entire account in one single day.
If you stick to the recommended lot sizes in the table above then you will drastically reduce the chances of losing your account. The losses that you will inevitably face will become much easier to manage.
For example, with the same $1,000 we would recommend using a 0.1 lot size which has a pip value of $1. Let’s now use the same scenario as before.
-100 pips x $1 = -$100
In the same trade, we have cut the potential loss down by 90%. In order to blow your account, you would now have to lose ten trades in a row which is extremely unlikely, even if you have a poor win rate.
You may already be thinking that even though this minimizes our losses, it also reduces our potential for profit. While this is true, account preservation and protecting your capital is one of the most important skills a trader can learn.
After all, you cannot trade if you don’t have any money in your account.
Tip: Make sure you apply these rules EVERY single time you trade, with no exceptions. It’s a tool that will protect your overall account balance while still giving you enough room to make some nice profit.
We will look at risk management in much greater detail in Unit 5 where we will show you some other strategies and skills that you can use to minimise your risk even further. So, for now, let’s carry on with some of the basic fundamentals of understanding the market.
Understanding Pips
What is a pip?
If you have done any research on forex before or if you have spent some time looking over the markets already then you will surely have come across the term “pip” (sometimes referred to as a “point”).
Note: It’s vital that you understand what a pip is as this will be the fundamental unit that you measure your forex trades in. When we make a trade, we normally target a predetermined number of pips for our entry points and stop losses.
A pip (percentage in point) is the unit of measurement that we use to express the change in value between the currencies in our currency pair.
To be exact, a pip is a standardised unit and is the smallest amount that any currency pair quote can change. Because of this, a pip is usually the last decimal place in a currency pair.
As a rule of thumb, most of the currency pairs in the forex market are quoted to four decimal places. In this instance, the fourth decimal place is the pip, as shown below.

In fact, all of the majors are quoted to four decimal places, except for when the Japanese yen is the quote currency. In those instances, there are only two decimal places, and yeah, you guessed it, the last decimal place is the pip, as shown below.

Pips in action
Let’s take a look at some examples of market movements in terms of their pip value.
Example: one pip move
If the value of the GBP rises against the dollar by one pip then we would see a move like this.
In this example, the value of GBP has risen by 1 pip against USD. If we were longing on this move, we would have made a 1 pip profit.
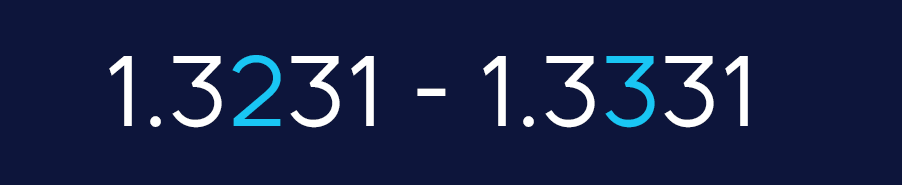
Example: 100 pip move
If the value of the GBP rises against the dollar by 100 pips then we would see a movie like this.
Average pip movement in the market
On average, forex markets usually move anywhere between 80-100 pips per day. Of course, this differs between each market but that is a reasonable average to draw from.
Now, this may not seem like much, and on the grand scheme of things it isn’t, but when we include the use of leverage and margin trading, we can profit quite significantly from these kinds of moves in the market. More on that later in this unit.
Pipettes
If you go on to your brokerage and see that the Yen is trading with three decimal places or if you see GBP/USD trading to 5 decimal places, don’t worry.
As a rule of thumb, if there are five decimal places displayed, then the fourth decimal is the pip. If there are three decimal places, then the second is pip.
In these examples, the 5th and 3rd pips would be what we refer to as pipettes and are not particularly important in terms of our trading strategies.
Trades
Whenever you are trading in any sort of market you will likely come across the terms “going long” and “going short”. But what exactly do they mean?
Buy/ Long
To “go long” in forex is to BUY a currency with the expectation that it’s value will RISE so you can then close your trade for profit. The aim – Buy low, sell high.
Sell/ Short
To “go short” in forex is to SELL a currency with the expectation that its value will FALL so you can then close your trade for a profit. The aim – Sell high, buy low.
How does a trade work?
Whenever we make a trade, we can also call it entering a position. A position is the amount of currency that you own that is subjected to market exposure and thus its value will fluctuate against other currencies in the market.
Important: Every currency trade that we make involves a pair. This means that you will always be going long on one currency while simultaneously going short on the other.
In other words, when we enter a long position, we are hoping that the base currency strengthens against the quote currency.
For example, we buy EUR/USD at 1.114 – This means that we are long on the Euro while simultaneously being short on the US Dollar.
In its essence, we are betting that 1 EUR would be worth more than 1.114 USD at the end of the trade.
This may seem complicated, but this is in fact how all of the trading markets work across the globe. Let’s take an example from the London Stock Exchange.
Let’s say we buy some shares in GlaxoSmithKline(GSK) at £18. This means we are going long on GlaxoSmithKline against GBP – in other words, we are going long on GSK shares while shorting GBP because we feel that the value of the GSK shares will grow in value faster than GBP will.
If this was a forex currency pair we would call it GSK/GBP.
Shorting Explained
While longing is a relatively straightforward concept, people tend to have a harder time understanding the concept behind shorting.
At its most basic level, shorting is the exact opposite of longing, but for the sake of clarity let’s clear it up here.
When you short a currency pair, the base currency is SOLD while the quote currency is bought. This is what gives the simultaneously longing and shorting in every trade.
Example:
Shorting USD/JPY = selling USD and buying JPY.
We are effectively betting that the USD will decrease in value against JPY.