How to trade the head & shoulders pattern
The head & shoulders chart pattern is a powerful charting pattern used in technical analysis. This ultimate guide of chart pattern mastery will show you how to start trading the head & shoulders pattern like a pro.
Share:
The Head & Shoulders is an extremely popular and easy to spot chart pattern used in technical analysis. After you read this guide you will know exactly what to look out for whilst trading. The pattern appears on all times frames and can, therefore, be used by day and swing traders as well as investors. Entry levels, stop levels and price targets make this trading formation easy to implement, as the chart pattern provides important and easy-to-see levels.
What the head & shoulders pattern looks like
First, let’s look at the formation of the head and shoulders pattern:
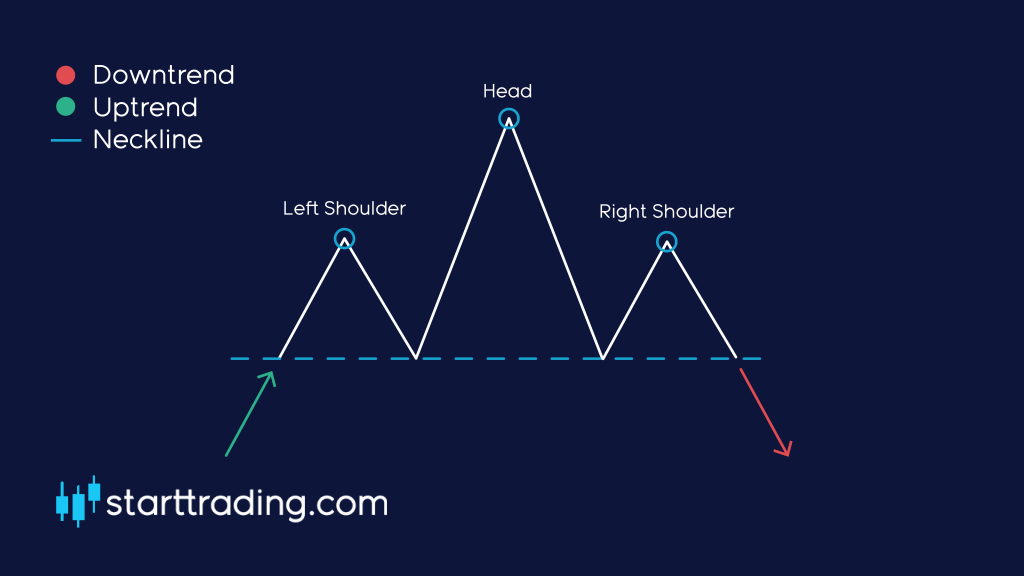
Commonly seen at market tops.
Formation of the pattern:
- Left shoulder: Price rise followed by a left price peak, followed by a decline.
- Head: Price rise again forming a higher peak.
- Right shoulder: A decline occurs once again, followed by a rise forming the right peak which is lower than the head.
As you can see from the image above, it is very similar to the triple top, however the peaks are of different heights and the neckline is not strictly horizontal.
A head and shoulders pattern is formed first by a peak (the shoulder) followed by a higher peak (the head) followed by another lower peak (the second shoulder).
In this instance, we draw the neckline by connecting the two lowest points that are visible from the pullbacks. More often than not the line will not be straight, but don’t worry this is typical for a head and shoulders pattern.
Placing the neckline
How to trade the head and shoulders pattern
So how do we trade this? Well, we use the exact same method as the triple top and double top. Simply wait for a clean break of the neckline and then enter our SELL positions. We can expect a pullback to be a similar distance to the difference between the head and the neckline.
Tip: Some traders say that the signal is more accurate when then neckline is a downslope. This would signify that the market is clearly losing strength and the possibility of a clean break of the neckline is more likely.
Chart pattern formations are rarely textbook perfect, meaning there may be some discrepancies between the respective shoulders and head.
It is very important that traders wait for the pattern to complete. One should not assume that a pattern will develop or that a partially developed pattern will become complete in the future. Partial or nearly completed patterns should be watched, but no trades should be made until the pattern breaks the neckline.
In the head and shoulders pattern, we are waiting for price action to move lower than the neckline after the peak of the right shoulder. For the inverse head and shoulders, we wait for price movement above the neckline after the right shoulder is formed.
Placing your stop-Loss
In the traditional market top pattern, the stop-loss is placed just above the right shoulder (topping pattern) after the neckline is penetrated. As a break above this point is usually where the pattern becomes invalidated. Alternatively, the head of the pattern can be used as a stop, but this is likely a much larger risk and reducing the reward to risk to reward ratio of the pattern.
Why the head and shoulders pattern works
No pattern is perfect, nor does it work every time. Yet there are several reasons why the chart pattern theoretically works:
- As price falls from the market high (head), sellers have begun to enter the market and there is less aggressive buying.
- As the neckline is approached, many people who bought in the final wave higher or bought on the rally in the right shoulder are now proven wrong and facing large losses – it is this large group that will now exit positions, driving the price toward the profit target.
- The stop above the right shoulder is logical because the trend has shifted downwards – the right shoulder is a lower high than the head – and therefore the right shoulder is unlikely to be broken until an uptrend resumes.
- The profit target assumes that those who are wrong or purchased the security at a poor time will be forced to exit their positions, thus creating a reversal of similar magnitude to the topping pattern that just occurred.
- The neckline is the point at which many traders are experiencing pain and will be forced to exit positions, thus pushing the price toward the price target.
- Volume can be watched as well. During inverse head and shoulder patterns (market bottoms), we would ideally like the volume to expand as a breakout occurs. This shows increased buying interest that will move price toward the target. The decreasing volume shows a lack of interest in the upside move and warrants some scepticism.
Disadvantages of trading head and shoulders
As stated, no trading pattern is perfect. Here are some potential problems with trading a Head and Shoulders pattern:
- You need to find patterns and watch them develop, but you should not trade this strategy until the pattern is completed. So it could mean a long period of waiting.
- It will not work all the time. During times of high volatility, the stop-loss levels will sometimes be hit.
- The profit target will not always be reached, so traders may wish to fine-tune how the market variables will affect their exit from the security.
- The pattern is not always tradable. For example, if there is a massive drop on one of the shoulders due to an unpredictable event, then the calculated price targets will likely not be hit.
- Patterns can be subjective. One trader may see a shoulder, where another does not. When trading patterns, define what constitutes a pattern for you beforehand – given the general guidelines above.
Inverted head and shoulders
As with most of these patterns, there is always a mirror pattern that works in the exact same way. Here is an example of an inverted head and shoulders pattern.
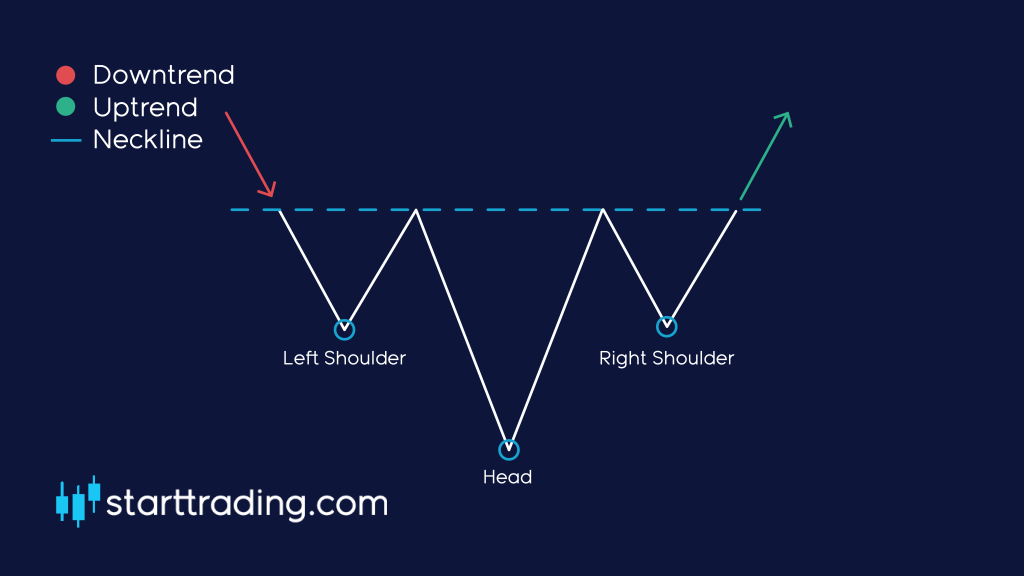
As you would expect, the inverted head and shoulders pattern only arises in a downtrend and must meet all of the same criteria as the standard head and shoulders pattern.
We simply place a LONG once there is a clear break of the neckline and the trend reversal is confirmed.
Conclusion
Head and shoulder patterns occur on all times-frames, and can be easily seen visually. While subjective at times, the complete pattern provides entries, stops and profit targets, making it easy to implement a trading strategy. The pattern is composed of a left shoulder, head, then followed by a right shoulder.
The most common entry point is a breakout of the neckline, with a stop above (market top) or below (market bottom) the right shoulder. The profit target is the difference of the high and low with the pattern added (market bottom) or subtracted (market top) from the breakout price. The system is not perfect, but it does provide a method of trading the markets based on logical price movements. (Profit-taking opportunities abound using this lesser-known pattern.
Share: