1. Home
  2. /
  3. Uncategorized
  4. /
  5. Page 2

What is a Chief Financial Officer (CFO)?

What is a Chief Financial Officer (CFO)?

Definition:

chief financial officer (CFO) is a company executive who is responsible for making financial decisions to advance the company’s financial situation.

Share:

Share on facebook
Share on twitter
Share on linkedin
Share on whatsapp

What is a Chief Financial Officer?

A CFO is responsible for the short-term and long-term financial growth of a company. CFOs oversee the company’s day-to-day cash flow. They also make decisions regarding a company’s capital structure (which is the company’s combination of equity and debt) and making sure the company gets the best return. The CFO usually ranks third in the company’s organizational chart — though, the CFO is the highest financial executive in the company. CFOs typically report to the chief executive officer (CEO). CFOs often have advanced degrees and extensive career experience. In return, the CFO is often one of the highest-paid employees at a company. investing or trading your hard-earned money, it is a good idea to get an understanding of the market.

A CFO is ultimately responsible for making sure money is coming in and going out in such a manner as to benefit the long-term financial health of the organization. If there’s a problem, they let the club president (the CEO) know, and a plan can be formulated to get back on track.

What are the CFO’s responsibilities?

The CFO is one of the most important figures at any company. As the head of all financial aspects of the organization, the CFO has many responsibilities.

Reporting:

One of the primary duties of the office of the CFO is to report on and present the financial situation of the company. They do this for the benefit of company leadership so that they can make decisions regarding the company’s future. They also prepare financial statements to report the company’s financial situation to shareholders and analysts.

Financial Management:

The CFO is responsible for overseeing the management of the company’s finances. This job includes the day-to-day money management of analyzing the company’s revenue and expenses. It also includes bigger-picture decisions about investing and determining the best debt-to-equity ratio for their company. They’re also responsible for helping the company get the best return on that equity or debt.

Financial Strategy:

In addition to managing the company’s current finances, the CFO is responsible for the long-term financial strategy of the company. They do this in coordination with the chief executive officer and board of directors.

Leadership:

The CFO doesn’t do any of this alone. Instead, their focus is on the big-picture, and they typically delegate the lower-level tasks to those working under them. Being able to hire and lead well is a massive part of the CFO’s job because they can only achieve their goals for the company if the people working for them are able to carry out their vision accurately.

Some large nonprofit organizations also employ CFOs, and those executives have a unique set of responsibilities and challenges. Nonprofit organizations have different financial goals than corporations, and therefore their CFOs may have entirely different objectives in their roles.

Nonprofit organizations have different rules that govern their financial activities. These differences require that nonprofit CFOs have a firm grasp of nonprofit finance laws. Nonprofit organizations also have different goals for their money. In private companies, the primary goal is to increase profits. That’s what the board of directors expects of executives, and they often financially reward executives who can make that happen. In nonprofit organizations, the goal is to raise money to carry out their mission and to use that money efficiently. They’re often working with money from donors who likely want their donations going toward a cause near and dear to them, not to bonuses for executives.

Finally, nonprofit organizations often have constrained resources. Most nonprofit organizations aren’t large enough to necessitate a CFO, and those that can probably can’t compete with corporate CFO salaries.

What skills should a CFO have?

With the extensive amount of responsibility CFOs have, there is also a very particular skill set they must have. First and foremost, a CFO needs to have a deep understanding of financial matters. Since they’re responsible for guiding the financial direction of the company, they need to have a firm grasp on everything that entails. Many have a background in accounting and business finance that has allowed them to gain the experience they need for the job.

CFOs also have to be influential leaders. In addition to planning the company’s financial goals, they also hire and manage the people who carry out that vision. The CFO’s ability to lead their team will make a difference in the company’s financial success.

As technology changes, companies often look to hire CFOs who can adapt to the new technology of the financial world. This skill will help them to lead their company to stay competitive with the financial advancements of other companies.

A CFO’s ability to create relationships is also an essential part of the job. They work closely with others within their company, such as the chief executive officer and chief operations officer, as well as others in the financial industry, such as investors and financial institutions.

What are the benefits and limitations of being a CFO?

For those in the financial industry, the role of CFO is one that is highly sought after, and for a good reason. It’s the highest-ranking financial job in any company. One of the definite perks of a CFO job is compensation. With the average CFO raking in well over $100,000, they’re one of the highest-paid employees in a company. CFOs also get a lot of non-salary perks like bonuses and other cash incentives.

The financial management industry, which encompasses CFOs, is a fast-growing industry. While most industries are growing at a rate of 5% over 10 years, the Bureau of Labor Statistics estimates that financial management is growing at a pace of 16%. This outlook is good news for anyone working toward a job in that field.

For someone with a passion for finance, it can also be an incredibly fulfilling job. The CFO oversees the financial strategy of the company and can have a role in guiding the company’s long-term goals. They can be a considerable part of their firm’s success.

Despite the benefits of the CFO role, there are tradeoffs as well, as there are likely to be with any job. First, there is a significant amount of experience (10 or more years) required for getting a job as a CFO. Many CFOs also have costly degrees that got them to that role.

The industry is also highly competitive. Not every company has a CFO, which might limit the number of CFO jobs available. This limitation increases competition for those jobs and might require a candidate to relocate to find a job as a CFO. The compensation is also going to vary widely from one company to another. A CFO at a mid-sized regional company isn’t going to get the same salary and benefits as someone working at a Fortune 500. CFOs also often get a lot of their compensation from bonuses, which may shrink if the company’s performance goes down.

Finally, the job of a CFO brings with it a significant amount of responsibility. The CFO reports to the CEO who reports to the board of directors. There’s a lot of pressure on CFOs to make sure the company is excelling financially and that profits are increasing.

What is the difference between CFO and CEO?

The CFO and the Chief Executive Officer (CEO) are two of the top executives in any company. And while the two work closely together, they have very different responsibilities. The CFO oversees the financial aspects of the company, whereas the CEO oversees everything in the entire company.

The CEO is the highest-ranking executive in the company. The CFO is typically the third highest-ranking executive, after the CEO and the Chief Operating Officer (COO), the person who is responsible for overseeing business operations. The CFO reports to the CEO, and the CEO reports to the board of directors.

Like the CFO, the CEO focuses primarily on big-picture goals. CEOs delegate most of the detail tasks and instead work with other company executives to craft the overall vision for the organization. One of the executives they work with is the CFO to help meet the long-term financial goals of the company.

The two executives also have very different public images. The CFO builds relationships with other people in the financial industry, such as banks, investors, and financial institutions. The CEO usually plays a much more public role in the company — They are essentially the face of the company.

C-Suite executives (aka those with the term “chief” in their title) tend to be some of the highest-paid in any company. Being the third-ranking executive, the CFO is generally the third highest-paid employee. The median CEO salary in the United States is just over $750,000. The second-highest-paid is the COO, with a median salary of just over $450,000. Finally, the median CFO salary is just over $360,000. C-Suite executives are unique in that a large portion of their annual pay typically comes in the form of bonuses and other cash incentives. Therefore, the salary doesn’t tell the whole story.

Share:

Share on facebook
Share on twitter
Share on linkedin
Share on whatsapp

How To Trade Trend Lines

How to trade trend lines. Trend line strategy explanded.

Share:

Share on facebook
Share on twitter
Share on linkedin
Share on whatsapp

Trend lines are one of the most versatile tools in trading. You can use it in day trading, swing trading or even position trading.

However, most traders get it wrong.

That’s why in this detailed guide on trend lines, you’ll learn:

  • What is a trend line and how does it work
  • How to identify a trend line correctly (that most traders never find out)
  • How to use trend lines to identify the direction of the trend — and tell when the market condition has changed
  • How to trade the trend
  • How to ride massive trends using a simple trend line techniques

The vast majority of this consistency will rely upon your ability to quickly and accurately identify trends and then position your entry and exit points effectively within them. Remember, “the trend is your friend”. It’s cliche, but it’s true.

What is a trend?

Okay, so first things first, we need to define what a trend is before we can spot one.

At its most basic level, a trend is the general direction in which the market is moving

There are typically three main trends in which we would look to identify, an uptrend (bullish), and downtrend (bearish), or a sideways/flat trend.

There is no set time for which a market must be moving for it to be considered a trend, however, the longer a trend remains valid then the more solid and qualified the trend becomes.

How do you identify a trend?

The simplest way of identifying a trend is to pull up the chart and watch the price action of the currency pair.

Price action is shown on most charts in the form of candlesticks. These candlestick display historic price movements of an asset over a given time frame and are plotted on a chart.

This allows us to easily visualise trends and determine what general direction the market is moving in.

For most, if not all of our trading strategies, we will be looking to trade in uptrends or downtrends.

There are certain situations in which you may enter into a sideways market but these are few and far between and have a lot more risk attached. It’s better to stick to clear uptrends and downtrends and enter your positions with more confidence in the direction the trend is moving in.

Let’s break each one down and look at what qualifies as an uptrend or a downtrend.

Types of trend lines

As you may have noticed already, the market does not move in perfect straight lines. It is always fluctuating and oscillating, creating new highs and lows all the while.

It is for this reason that we must learn how to draw trend lines on a chart so that we can have a better chance at predicting where the new support and resistance zones will be.

Trend lines are likely the most common out of all the forms of technical analysis that you will see forex traders use. They are simple but very effective.

The two most common trend lines that we will draw on our chart will be on the uptrends and downtrends that we spot in the market – that way we can more easily visualise the trend.

Uptrend

As I am sure you have already guessed, an uptrend describes the price action of the market when the overall direction is considered to be upwards.

If you can see that the price is clearly moving up over a period of time, then the chances are you are looking at an uptrend in the market.

The fully qualify as an uptrend, each peak and trough of the price action should be higher than the previous peaks and troughs. In other words, we would need to see a series of “higher highs and higher lows”.

As you can see from the example above, the peaks of each movement in the price action are higher than the previous highs. We can also see that each low is higher than the previous low.

This indicates an upward momentum and the market is being pushed higher.

In general, we should be looking for opportunities to go long and try to ride the trend out. 

Downtrend

There are no points awarded for guessing what a downtrend is. Yep, a downtrend is what describes the price action when the overall direction is considered to be downwards.

When we see that the price is clearly falling over a given period of time, you will most likely be looking at a downtrend.

In direct contrast to an uptrend, we identify a downward trend by spotting “lower highs and lower lows” in the market.

We are looking for when each trough drops a little lower than the previous low and when each high looks to be weakening when compared to the last high,

This signifies that the market may be running out of steam and we have hit some buyer exhaustion. The market is now bullish and the trend is downward.

In general, we should be looking for opportunities to short the market on this occasion and ride the trend downwards.

How to draw a trend line?

Luckily this is pretty simple. All you have to do is find two major tops or two major bottoms in the market and connect the two points. It really is as easy as that.

Here are a couple of examples:

Uptrend

For an uptrend, we draw the trend lines underneath the structure along clear support points that we observe the price to rebound from.
 

Downtrend

In a downtrend, we draw the trend lines on top of the market structure along the clear resistance points that we observe the price to rebound from.
 

Not all trend lines are made equal

It is important that you understand the validity of the trend lines that you’re drawing. Just because you have connected two points in the market it doesn’t mean that this will be an obvious point of support or resistance.

In fact, most traders would not consider the trend to be valid until the price hits the trend line at least three times.

Here are some simple rules to keep in mind when assessing the validity of your trend lines:

  • The more times that the trend line is tested and successfully holds, the more valid it becomes. Imagine that the line becomes stronger each time it successfully resists the price movements.
  • You need two clear tops or bottoms to draw a valid trend line, but this is the weakest possible trend line you can get. It takes at least three to form a valid trend line.
  • Horizontal lines are the strongest. The steeper the trend lines become, the less likely the are to hold their level.

TIP: Do not force trend lines onto your chart. Far too often people will draw trend lines to try and support their own theories. These should be OBJECTIVE lines that clearly fit onto the chart. If you’re forcing it, then it almost certainly is not a valid trend line.

The trend is your friend

We have already mentioned this famous cliche once in our course, but it’s worth mentioning again. The trend IS your friend – seriously.

Many novice traders will try to predict moments of market reversals by constantly trade AGAINST the market. As trading is technically a zero sum game, it may seem counterintuitive to “follow the crowd” and trade with the trend but that is exactly what you must do if you are to be successful.

Typically, traders will see that the market is rising and will assume that this cannot and will not continue for much longer. If it is going up, it must come back down. And while that is true, it is exceptionally hard to pick a point of a reversal.

Put it this way, it is extremely difficult to predict a trend in advance when compared to identifying one that is already there.

This often goes against a lot of traders grains, which is potentially why so many people end up losing money in the market.

Experience shows that it is MUCH easier to profit by taking advantage of a current market trend rather than trying to accurately predict a new one. Why make it harder for yourself when you don’t have to?

Channels

When we draw a trend line, we are simply drawing one line on the chart to identify and uptrend or downtrend.

To create a channel, we draw two lines for the same trend, these act as the upper and lower trend lines. These upper and lower trend line signify the market support and resistance zones.

 
We use channels to gain a better perspective on the market structure and it will usually signify logical points to enter and exit our trades. These can be some of the easiest and most profitable trading situations that you encounter, you just have to be able to spot them accurately.
 

Note: For a channel to be valid, both of the trend lines must be parallel to each other. Most chart software will have a channel drawing tool to help you do this.

Share:

Share on facebook
Share on twitter
Share on linkedin
Share on whatsapp

What is a Forex Pip?

What is a Forex Pip?

This guide provides a quick overview of the fundamentals of Forex pip values, Forex pip meaning, what a pip is and how to calculate profits and losses in pips. By the end of this guide, you will understand how to calculate pips when trading forex currency pairs.

Share:

Share on facebook
Share on twitter
Share on linkedin
Share on whatsapp

If you’ve done even the slightest bit of research into the Forex (FX) market than you’ve probably heard of the terms “pips,” “points”, pipettes,” and “lots” thrown around a lot. If you are new to trading currencies this may all seem extremely confusing and alien-like terms. 

We put this guide together to explain what pips are and show you how pip values are calculated. By the end of this guide, you will have a solid understanding of what a Forex pip means.

Note: Please take your time with this information, as it is required knowledge for all forex traders. Don’t even think about trading until you are comfortable with pip values and calculating profit and loss. 

Here is where we’re going to do a little math. Don’t worry it won’t get too complex.

What is a pip?

A “Pip”, short for point in percentage, is the unit of measurement used to express the change in value between two currencies forex market. 

When we make a trade, we normally target a predetermined number of pips for our entry points and stop losses. A pip (percentage in point) is the unit of measurement that we use to express the change in value between the currencies in our currency pair.

To be exact, a pip is a standardised unit and is the smallest amount that any currency pair quote can change. Because of this, a pip is usually the last decimal place in a currency pair.

A pip is a standardised unit and is the smallest amount by which a currency quote can change. It is usually $0.0001 for U.S.-dollar related currency pairs, which is more commonly referred to as 1/ 100th of 1%, or one basis point. This standardized size helps to protect investors from huge losses. For example, if a pip was 10 basis points, a one-pip change would cause greater volatility in currency values.

As a rule of thumb, most of the currency pairs in the forex market are quoted to four decimal places. In this instance, the fourth decimal place is the pip, as shown below.

What Does Pip Stand For?

Some say that the term “pip” originally stemmed from Percentage-In-Point, others claim it stands for Price Interest Point. Whatever the origin of the term, pips allow currency traders to discuss small changes in exchange rates in readily understandable terms.

The value of a pip varies based on the currency pairs that you are trading and depends on which currency is the base and which is the quote currency.

Most currency pairs go down to 4 decimal places, but there are some exceptions like Japanese yen (JPY) pairs, which go down to two decimal places). For example, 1 Pip for EUR/USD is 0.0001, and for USD/JPY, it is 0.01. As shown below:

Calculating the value of a pip

Let’s take a look at some examples of market movements in terms of their pip value.

Example: one pip move

If the value of the GBP rises against the dollar by one pip then we would see a move like this.

In this example, the value of GBP has risen by 1 pip against USD. If we were longing on this move, we would have made a 1 pip profit.

Example: 100 pip move

If the value of the GBP rises against the dollar by 100 pips then we would see a movie like this.

Why are pips different between currency pairs?

The value of one pip is always different between currency pairs because of differences between the exchange rates of various currencies. A phenomenon does occur when the U.S. dollar is quoted as the quote currency. When this is the case, for a notional amount of 100,000 currency units, the value of the pip is always equal to US$10.

Now I know what a pip is, what is a Pipette?

There are forex brokers that quote currency pairs beyond the standard “4 and 2” decimal places to “5 and 3” decimal places. They are quoting FRACTIONAL PIPS, also called “pipettes.”

If you found the concept of a Pip a confusing concept, we are about to make you even more confused and point out that a “pipette” or “fractional pip” is equal to a “tenth of a pip“.

For instance, if GBP/USD moves from 1.30542 to 1.30543, that .00001 USD move higher is ONE PIPETTE.

Average pip movement in the market

On average, forex markets usually move anywhere between 80-100 pips per day. Of course, this differs between each market but that is a reasonable average to draw from.

Now, this may not seem like much, and on the grand scheme of things it isn’t, but when we include the use of leverage and margin trading, we can profit quite significantly from these kinds of moves in the market. More on that later in this unit.

Summary

You should now have the answer to the question of ‘what a pip is in trading’. Being conversant with the unit of measurement for changes in FX rates is an essential first step on the path to becoming a proficient trader. If you enjoyed this discussion of FX pips in investing, why not take a look at our article on the best currency pairs to trade in Forex?

What Are The Best Currency Pairs to Trade?

Build your trading skills with the Starttrading.com academy

Want to learn how to trade? The hardest part of trading is that all-important first step. At starttrading.com we make this step that little bit easier, you don’t have to start trading alone. Take your trading to the next level, simply sign up to our FREE online trading course so that we can give you the help you need today!

Share:

Share on facebook
Share on twitter
Share on linkedin
Share on whatsapp

7 Steps to Start Trading Cryptocurrency Like a Pro

How to start trading cryptocurrency in 7 simple steps

Learn everything you need to know about Bitcoin (BTC), Ethereum (ETH),  Litecoin (LTC) or any other cryptocurrency, as-well as how to get started trading them in 7 simple steps.

Share:

Share on facebook
Share on twitter
Share on linkedin
Share on whatsapp

If you are reading this, you have probably heard of cryptocurrencies or more specific, the top trending cryptocurrency called Bitcoin. Another concept that has probably led you to this article is trading, whether it is stocks, the foreign exchange market or cryptocurrencies. However, this trading ultimate guide mainly focuses on cryptocurrencies and how to get started trading them.

Instead of going into all the details and lengthy discussions of the blockchain, bubbles, regulations, temporary hype etc, the fact remains that people are making money trading cryptocurrencies and you could be amongst them. It can be extremely difficult to find an accurate step by step guide on how to start trading cryptocurrencies but let’s just say you came to the right place.

Here is a 7 step guide for you to follow so that you can enter into the cryptocurrency markets and start earning today.

  1. Understanding cryptocurrency
  2. Learn to trade the cryptocurrency market
  3. Choose a cryptocurrency exchange
  4. Choose a cryptocurrency wallet
  5. Find a cryptocurrency to trade
  6. Manage your risk
  7. Start trading

1. Understanding cryptocurrency

Before investing or trading your hard-earned money, it is a good idea to get an understanding of the market.

Cryptocurrencies are tradeable digital assets or digital form of money. This virtual money is decentralised, meaning they are not backed or controlled by a government or a central bank of any country.

One of the most famous cryptocurrencies is Bitcoin, which was invented to create an alternative currency for anyone who wanted to opt-out of the traditional banking system during the 2008 Financial Crisis. Cryptocurrencies like Bitcoin want to make financial transactions more open and accessible to everyone around the world – which is why they have become so popular in recent years. Bitcoin transfers can be done with minimal processing fees – avoiding the high fees charged by traditional financial institutions.

How does cryptocurrency trading work? 

Just like trading the Foreign Exchange (Forex) market, cryptocurrency trading is the buying and selling of currencies to generate a profit. In its simplest form, you’re betting on the changing price difference between two different currencies. These funds are then used to place buy and sell orders against another currency. You make profits from selling, or closing orders at a higher price than you bought.

Trading cryptocurrencies works exactly the same as the forex market trading, but instead of selling and buying fiat currencies, such as euros or US dollars, traders buy and sell cryptocurrencies, such as Bitcoin, Ethereum or Litecoin.  You will usually exchange a fiat currency into a cryptocurrency and then, at a later date, back into a fiat currency, although there are traders and exchanges that allow cryptocurrency-to-cryptocurrency trading.

For example, you might speculate on the change of price between the Bitcoin and the US dollar.

If you think Bitcoin will increase in value you might enter a “Long” position. This means you buy Bitcoin as you believe that it will increase in value relative to the US dollar.

If you think Bitcoin will decrease in value you might enter a “Short” position instead. This means that you sell Bitcoin as you believe that it will decrease in value relative to the US dollar.

2. Learn how to trade the cryptocurrency market

You may or may not have some experience in trading the Stock or Forex (FX) markets, but the Cryptocurrency market is a whole different ‘game’. It is advised to study the cryptocurrency charts first before starting to trade them. Do not to assume that your skills attained by trading other markets will be sufficient and that your trading strategies will work the same in the crypto market. Traders often assume that skills and trading strategy’s developed in alternative financial markets can be applied to others, you need to take time and research each market respectively.

If you are a new trader in general, it is advised that you either start with a demo trading account and train yourself, or sign up to our FREE online trading academy which is designed to help you prepare for success in the financial markets. Not only will we teach you the technical and fundamental side of trading we will also teach you the mentally needed to trade like a pro. Simply sign up for a free account and learn how to trade today.

It is important to find a strategy for each trade you will make and apply these strategies in the cryptocurrency market. We have spent years developing ours, it may seem daunting at first but once you pick up the basics, picking up the rest of the knowledge can become a walk in the part.

What affects the price of a cryptocurrency?

Why is cryptocurrency so volatile? They are not as stable as currencies that have had centuries to develop. Bitcoin is the oldest coin on the market, and it has only been around since 2009. Nevertheless, there are a number of things that can affect cryptocurrencies:

No intrinsic value:

Most cryptocurrencies don’t sell a product, earn revenue or employ thousands of people. They generally don’t return dividends, and just a tiny amount of the total value of the currency goes into evolving it. Because of this, it is extremely difficult to value. How do we know if it is fundamentally overbought or oversold? When is it a good value or overpriced? Without any fundamentals to base this information off of, we can only rely on market sentiment, often dictated by the media that makes money on viewership.

Regulation:

The lack of regulation in the cryptocurrency space can play a factor in the volatility of the price. This low level of regulation allows for market manipulation. Often done by placing orders with the intent to cancel, whereas in a regulated market such as the foreign exchange placing fake orders is illegal. Creating these false orders can lead to a misrepresentation of market behaviour which can cause volatility with the false orders encouraging uncertainty.

Supply and demand:

Another reason the price of crypto is so volatile comes down to simple Economics. When the demand for an asset increases quicker than the supply, the price is likely to rise. We saw this come into play with Bitcoin during the Christmas period of 2017. The demand for Bitcoin was widespread due to the profit being made by traders throughout the year and the supply could not keep up with the massive uptake, which led to the price reaching an all-time high of around $20,000.

Lack of institutional capital:

While it is undeniable that some pretty impressive venture capital companies, hedge funds and high net-worth individuals are both fans of and investors in crypto, as a segment, most of the institutional capital is still on the sidelines. At the moment there has been little to no movement on a Bitcoin ETF or Mutual Fund, which is predicted to introduce much needed institutional volume into the cryptocurrency markets.

Media influence:

Just like government regulation, exposure in the media greatly affects a cryptocurrency’s price. Whenever a public figure makes a statement regarding cryptocurrencies or a major retailer starts accepting cryptocurrency as a form of payment, you will see the market respond.

Changes to technology:

When a cryptocurrency’s core technology is affected (either via an update or the finding of a flaw), the cryptocurrency’s price is also affected.

Market size:

The cryptocurrency market is only roughly 10 years old and still an emerging market. The total size of the cryptocurrency market is currently $250B. Although this is a huge amount, it is a small figure when compared to the foreign exchange market which totals around $5T per day. This is why the foreign exchange market is able to keep stability even when there are massive movements in the market. The same cannot be said about the cryptocurrency market. This allows a few big traders who hold a lot of currencies (referred to as whales) have the ability to shift the market by making huge transactions.


3. Choose a cryptocurrency exchange

Selecting a cryptocurrency exchange to purchase your first cryptocurrencies can be a daunting and overwhelming process. After all, there are over 200 cryptocurrency exchanges in today’s market, with 24-hour trade volume in the billions. So, how do you make your choice?

Here are a few attributes to look at while choosing your exchange of choice:

  • Geographical location and their constraints;
  • Transaction fees;
  • Security, anonymity, and customer support;
  • Ease of use and user interface;
  • Volume and liquidity of the exchange.

Note that the above list does not cover all needed attributes to consider while choosing an exchange but are a good solid basis to start off with. We will now take a closer look at each attribute named above:

Geographical location and constraints:

Two key things to consider while looking at the Constraints of Geographical locations of a crypto exchange is; Firstly, is the exchange limited to a specific geographical location or is it open to most countries, including yours. Secondly, is the exchange legal in your country. It would not help you if you were to register on an exchange which you cannot access or trade legally.

Depositing cryptocurrencies onto an exchange located in a highly politicized or anti-crypto country probably isn’t the smartest idea and could potentially cause more headache and strife in the future than its worth.

Transaction fees:

Another factor to consider is the fee’s charged by the exchange. If you plan on placing multiple trades on the exchange, this is an important factor to look out for.

Tip – The less fees you pay the exchange you more that stay in your pocket!

Security, anonymity, and customer support:

It is important to investigate the exchange’s history to find out whether the exchange has been subject to any past malicious attacks or phishing scams and also whether they engage with their community on a regular basis. While this may seem like common sense, avoid signing up for exchanges which have a known history of financial and security breaches, and who have disabled withdrawals for long periods of time.

It is advisable to look for exchanges with Two Factor Authentication (2FA) and Know-Your-Customer-Verification (KYC)

Volume and liquidity of the exchange:

An exchange with a large volume of trading is usually a good indicator of a crypto exchange’s liquidity and overall ability to fill a user’s order at any point in time. Based on the type of trading you’re looking to do, liquidity is an extremely important factor.

A highly liquid exchange with good volume will also reduce the spread and allow you to enter trades at better prices.

Ease of use and user interface:

If an exchange has a good User Interface, it is a good indication that they care about their user base and ease of buying and selling.

An easy to use trading platform will also make your life easier and make it less likely to cause you to make any mistakes. Remember that making a mistake whilst trading can result in you losing money!

A few exchanges to choose from are:

4. Choose a cryptocurrency wallet

After choosing your exchange, you need to create a crypto wallet to store and control your funds with. A cryptocurrency wallet is a place where you store encrypted passwords that represent your coins, it is the equivalent to storing money in a bank account.

There are several types of cryptocurrency wallets that provide different ways to store and access your digital currencies. To understand more about cryptocurrency wallets and how to decide which wallet is best for you, please read our guide on cryptocurrency wallets.

For beginners, we would recommend an online wallet for the ease of use and accessibility that they offer. An online wallet can be set up in a matter of minutes and function somewhat similar to online or mobile banking.

A few cryptocurrency wallets to choose from are:

It’s important to note that most exchanges have built-in wallets but it is best practice to store digital funds off exchanges as exchanges have fallen victim to hacks in the past. However, insurance companies are beginning to offer cryptocurrency insurance against theft.

5. Find a cryptocurrency to trade

After setting up your wallet, finding your exchange, and getting familiar with trading and the cryptocurrency markets you can now log onto your exchange and start trading. Before putting your money into any cryptocurrency, it is a good idea to first study the asset. Read our guide on how to evaluate different cryptocurrencies.

One of the best tools for this research is our cryptocurrency market cap page where you can find information on every coin and token available around the world. The data found there includes market capitalization, news, supply and trade volume. Listing them in chronological order of top cryptocurrency and can be used to know exactly what each coin represents and compare different cryptocurrencies with each other.

Tracking the latest cryptocurrency news daily is essential if you want to be successful in trading cryptocurrencies. Trading the news is very important when it comes to cryptocurrency trading, it’s important to use verified sources such as CoinDesk and CoinTelegraph. Learn how to start trading cryptocurrency news in our in-depth article. 

Be aware of false market hype and cryptocurrency scams, such as false ICOs. It is advised to study the token or coin thoroughly to make sure that you are buying a legitimate asset which will not disappear overnight. If you are still hesitant in which coin to buy you can always start on the top cryptocurrencies listed by market cap as they are the most popular at the moment with most people trusting them.

6. Manage your risk

Much like the diversification of other investment types, risk management is possible by diversifying a cryptocurrency portfolio. Going “all in,” so to speak, on one specific currency can be an incredibly risky move. Because of cryptocurrency’s volatility, beginner traders may want to start at a slow pace and gradually build a position. This is similar to dollar-cost averaging within stock investing. Plenty of traders also solely trade with only a fraction of their available funds or holdings.

Admittedly, keeping a portion of your money out of harm’s way could limit potential gain. However, it also limits losses. This means that you can continue to trade, as well as gain some wisdom from the experience.

Here are some tips to help you manage your risk like a cryptocurrency pro:

Only invest what you can lose:

If you are investing money you can’t afford to lose, you need to take a step back and re-evaluate your current financial situation, because what you’re about to do is an act of desperation. This includes: using credit cards, taking out mortgages, applying for loans, or selling everything and traveling the world (as glamorous as that sounds).

Always pay attention to Bitcoin:

Most altcoins (every cryptocurrency except Bitcoin) are pegged closely to Bitcoin. If Bitcoin price pump drastically, altcoins price can go down as people try to exit altcoins to ride the BTC profits; inversely, if Bitcoin prices dump drastically, altcoin prices can go down, too, as people exit altcoins to exchange back into fiat.

Never put all your eggs in one basket. Diversify:

While the potential to earn more is increased with the amount of money you invest into a coin, the potential to lose more is also magnified.

Don’t be greedy:

No one ever lost money taking a profit. As a coin begins to grow, the greed inside us grows along with it. If a coin increases by 30%, why not consider taking profit? Get into the habit of taking profits and scouting for re-entry if you want to continue reaping potential profits.

Don’t invest blindly:

There are people in this world who would sell a blind person a pair of glasses if they could make money. Those same people play in the cryptocurrency markets and use every opportunity to exploit less-informed investors. They’ll tell you what to buy or claim certain coins will moon, just to increase the prices so they can exit. Also remember to do your own research!

Always learn from your mistakes:

Never accept a total loss. Always evaluate the situation and try to figure out why it happened. Take that experience as an asset for your next move, which will be better because you are know more now than you knew before. We all start off as amateurs, and we have all lost money throughout out trading experience.

7. Start trading

After you have completed all the above steps, you are ready to start trading. Here are a few tips to remember before setting off into the cryptocurrency trading universe:

Tip 1

You don’t have to buy a whole coin. cryptocurrencies allow traders to buy fractions of coins. This is a feature not a lot of new traders know, thus demotivating them not to start trading due to the high price of coins such as Bitcoin (BTC). You simply do not need to buy 1 whole Bitcoin (BTC) and can simply buy a fraction of a Bitcoin (BTC). This is the same across most of the tokens created in the cryptocurrency market.

Most of the top coins are expensive, so consider buying fractions of these coins to start if you don’t want to start trading with enormous amounts of money. Rather consider and predict which cryptocurrency is most likely to increase in and retain value and focus less on its current price.

If you would like to own for example 10 Litecoin (LTC), you can periodically buy additional fractions and grow your portfolio whilst still keeping your balance. This is also a good strategy to optimize the average price, known as dollar-cost averaging.

Tip 2

Keep in mind that the cryptocurrency market is volatile at this stage of its life! There is always the chance that the market will move rapidly in any single moment. Thus, include this into your trading strategies and adapt as the market changes.

Tip 3

Don’t trade with money that you cannot afford to lose! If you have been in the trading scene for a while you will hear this phrase a lot. This term must not be misinterpreted. This phrase does not mean that you must be willing to lose this money, it only means that if the worst-case scenario plays out, you will not feel the impact of losing this money and still be able to live your life as before losing this money.

If you have the mentality that you can lose this money, you have already made your first mistake. The aim is not to be comfortable with losing money, but if this happens, you still have a basis to work from and not have to start from scratch again.

Conclusion

Cryptocurrency trading is still in its infant stage, if you can stick out the learning curve, you will be glad you started. Always stay calm and do not attach emotions to trading, have a strategy and follow it. Stay open-minded and do not let your emotions stop you from making trades.

The hardest part of cryptocurrency trading is that all-important first step to getting started. At starttrading.com we make this step that little bit easier, you don’t have to start trading alone. Take your trading to the right level, simply sign up to our FREE online trading course so that we can give you the help you need today!

Share:

Share on facebook
Share on twitter
Share on linkedin
Share on whatsapp

What are stock dividends and how do they work?

What are stock dividends and how do they work?

Many people have wondered what it would be like to sit at home, reading by the pool, living off of the passive income that arrives in the form of dividend payments from companies they are invested in. Dividend investing allows you to create a stream of income in addition to the growth in your portfolio’s market value from asset appreciation.

Share:

Share on facebook
Share on twitter
Share on linkedin
Share on whatsapp

Before you get started you must understand what dividends are, how companies pay dividends and the different types of dividends that are available. This step-by-step Dividends guide will walk you through everything dividends, ensuring you know exactly what dividends are and how to invest in dividend paying stocks.

What are stock dividends and how do they work?

A dividend is a payment that a corporation makes to owners of a companies stock, also known as shareholders. It is a way for companies to distribute revenue back to investors, and one of the ways investors earn a return from investing in a stock.

When you own stocks that pay dividends, you are receiving a share of the profits that the company makes. Let’s take a look at Coca Cola for an example. If they reach a profit surplus, they can choose to reinvest some of this money back into the organisation, or they also have the choice to pay their shareholders a portion of this profit, which is then called dividends.

In the United States, companies typically pay dividends quarterly, however, some companies pay monthly or semi-annually. A dividend is paid per share of stock, for example, if you own 50 shares in a company and that company pays $2 in annual dividends, you will receive $100 per year.

However, not all stocks pay dividends – if you are interested in investing for dividends, you will want to specifically choose dividend stocks.

What is dividend investing?

Dividend investing is a strategy of buying stocks that pay dividends in order to receive a regular passive income from your investments. This income is in addition to any growth that your portfolio experience as the stock gains value. A win, win if you are an investor.

If you own shares in a company that has a dividend reinvestment plan, or DRIP, you can also choose to have your dividends reinvested to buy additional shares, rather than having them paid out as a profit. This is a useful strategy for long term holders to build up their portfolio or when your dividends are small.

Experienced dividend investors will generally invest significantly in stocks that pay large dividend yields in order to make more money.

Types of dividend?

There are currently 4 popular dividend types, these are:

  1. Cash dividends

  2. Stock dividends

  3. Property dividends

  4. Liquidating dividends

Cash dividends

Cash dividends is currently the most common type of dividend. A certain cash pay-out is distributed to investors holding stock in the company. These pay-outs occur on specific dates chosen by the company’s board of directors and their size are in relation to the percentage stock each investor owns. Long term investors can reinvest their cash dividends to increase their stock holdings in the company.

Cash dividends are a basic way for companies to return capital back to their shareholders. Payment periods can be monthly, annually or any other time period chosen by the board of directors.

A company which offers cash dividend pay-outs are usually stable and well-established companies.

Stock dividends

Stock dividends are made in the form of additional shares, rather than cash, to investors. Stock dividends are usually paid out when a company has a short supply of liquid cash or when requested/ agreed upon by the investor(s).

The amount of stock dividends paid out to an investor are usually paid out in relation to the amount of stock that investor already holds. The more share an investor holds, the more additional share they receive with stock dividend pay-outs.

Stock dividends are also known as scrip dividends and have major tax advantages as these dividends are not taxed until they are sold by the individual investors.

Property dividends

Property dividends can include one of two options: A share/stock of a subsidiary company, or a physical asset owned by the company for example real estate, inventory etc.

Once these dividends are assigned, their price are recorded at market value of the linked asset. The investor may choose to sell the asset or hold on to it.

This is a very unpopular dividend and is usually only chosen if the company either does not want to dilute its current share position or does not have enough cash on hand to distribute payments.

These types of dividends can be very advantageous to investors as no tax is paid on them unless they are sold. The investor can choose to hold on to the asset and hope for further growth in the future.

Liquidating dividends

Liquidating dividends are payments which are made by a corporation to their shareholders during a liquidation, partially or fully. Liquidating dividends are usually not taxable to shareholders as they are seen as return of capital.

A disadvantage of these dividends occurs when a shareholder’s supporting company has deteriorated in their quality, leading to the liquidation amount not covering the shareholder’s initial investment.

Liquidating dividends usually do not have a pay-out date. Liquidation only occurs when a company is insolvent or when its operations end.

Which companies can pay dividend?

Only limited companies can pay dividends, as they are the only type of business that issues shares. Sole traders, partnerships and LLPs can’t pay dividends, because they do not issue shares.

Limited companies are only allowed to pay dividends if they have enough profit available to do so – dividend payments come out of profit after corporation tax. Even if the company has enough cash to pay the dividend, it is illegal for the dividend to be paid if there is no available profit.

Larger, more established companies with more predictable profits, such as blue-chip companies, are often the best dividend payers as they no longer need to reinvest to grow the business. They typically issue regular dividend payments because they aim to maximize shareholder wealth in ways aside from normal growth. Companies in the following industry sectors are typically been seen to maintain a regular record of dividend payments:

  • Basic materials
  • Oil and gas
  • Banks and financial
  • Healthcare and pharmaceuticals
  • Utilities

Start-ups and other high-growth companies, such as those in the technology or biotech sectors, may not offer regular dividends. Because these companies may be in the early stages of development and may incur high costs (as well as losses) attributed to research and development, business expansion and operational activities, they may not have sufficient funds to issue dividends. Even profit-making early- to mid-stage companies avoid making dividend payments if they are aiming for higher-than-average growth and expansion and want to invest their profits back into their business rather than paying dividends.

Investors in these companies are typically ok with not receiving any dividend due to these companies typically undergoing parabolic growth which makes up for the lack of dividend payments.

Why companies pay dividends?

Companies pay dividends for a variety of reasons, which have different implications and interpretations for investors.

Dividends can be expected by the shareholders as a reward for their trust in a company. The company management may aim to honour this sentiment by delivering a robust track record of dividend payments.

Dividend payments reflect positively on a company and help maintain investors’ trust. Dividends are also preferred by shareholders because they are treated as tax-free income for shareholders in many jurisdictions.

A high-value dividend declaration can indicate that the company is doing well and has generated good profits. But it can also indicate that the company does not have suitable projects to generate better returns in the future. Therefore, it is utilizing its cash to pay shareholders instead of reinvesting it into growth.

If a company has a long history of dividend payments, a reduction of the dividend amount, or its elimination, may signal to investors that the company is in trouble. However, a reduction in dividend amount or a decision against making any dividend payment may not necessarily translate into bad news about a company. It may be possible that the company’s management has better plans for investing the money. For example, a company’s management may choose to invest in a high-return project that has the potential to magnify returns for shareholders in the long run, as compared to the petty gains they will realise through dividend payments.

The bottom line

Lots of investors hope to find the next great IPO. While it’s exciting to get in on the ground floor of a successful company, you shouldn’t overlook opportunities with companies that are already successful. Cash-generating giants can line your pockets with the cash from dividend payments. As you collect your dividends, the stock value could grow—perhaps slowly, compared to successful IPOs, but much more steadily.

Share:

Share on facebook
Share on twitter
Share on linkedin
Share on whatsapp

Moving Averages Explained – How To Trade Using Moving Averages

What Are Moving Averages? Moving Averages Explained

The moving average is one of the most commonly used technical indicators, and for good reason. They are relatively simple concepts to grasp and they give us a simple view of the market trends and the recent price history.

Share:

Share on facebook
Share on twitter
Share on linkedin
Share on whatsapp

So what is a moving average?

A moving average is simply a line on our chart that signifies the closing price of each candle over a specific period of time.

You will notice that the charts we view can often seem chaotic with wild price fluctuations which make the graphs somewhat hard to read. Moving averages help to make sense of this by creating a smooth line that shows the historical price action.

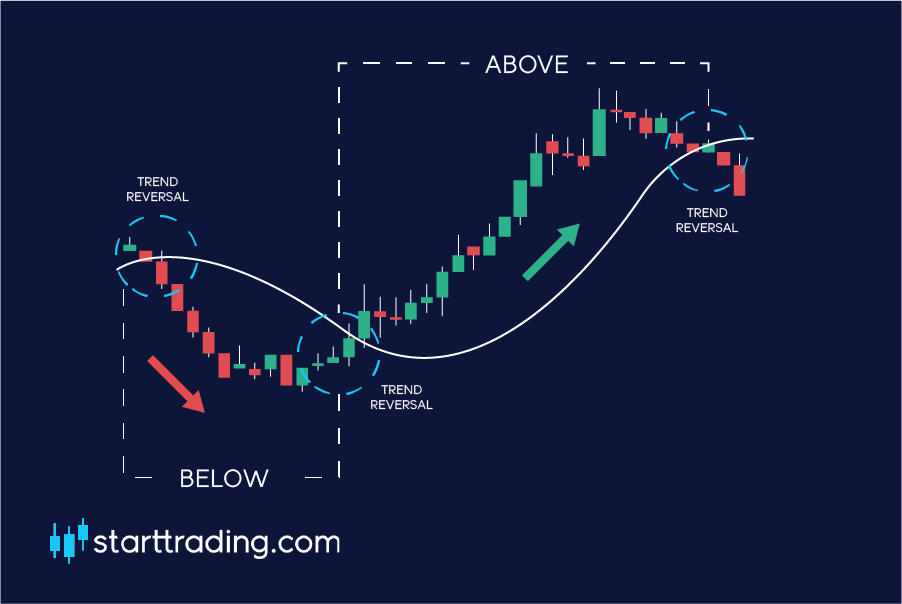
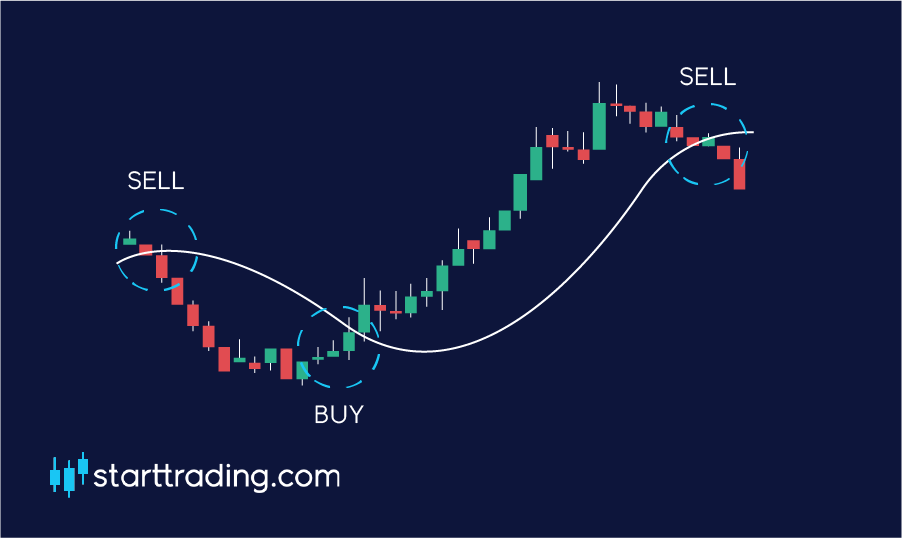
The main purpose of a moving average is to be able to more easily identify trends and to spot reversals as they are happening.

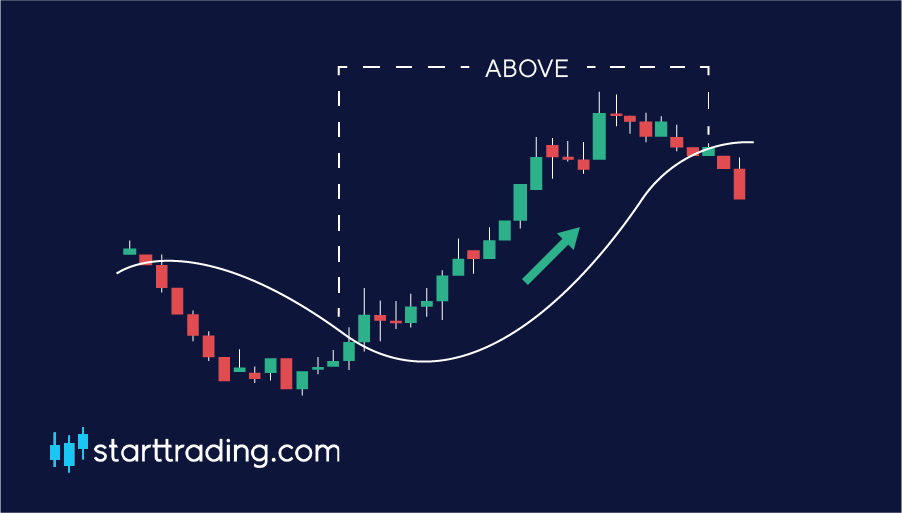
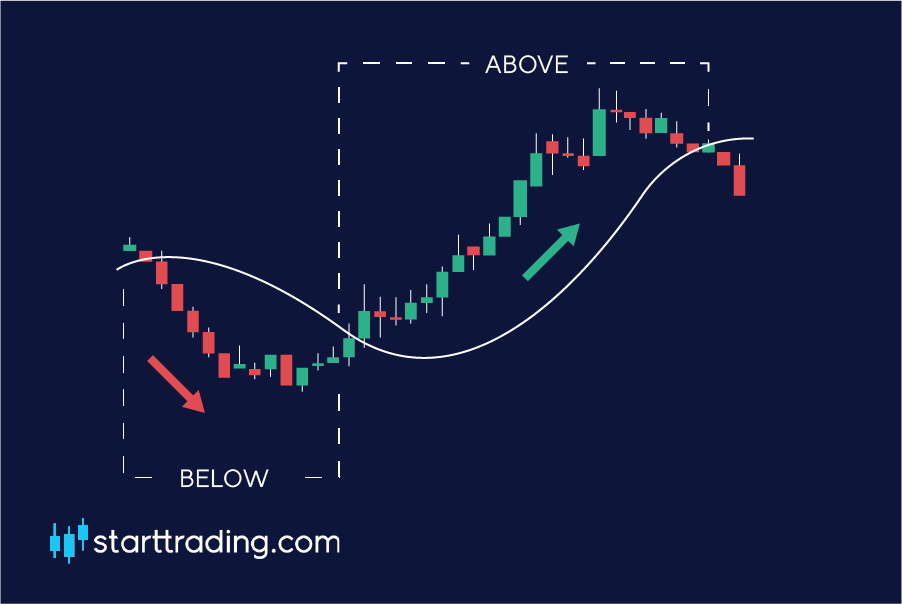
When the price of the currency pair is shown to be above the moving average, this is considered to be an uptrend.

On the other hand, when the price is shown to be below the moving average, this is considered to be a downtrend.

When the trend line is broken, we would consider this to be a trend reversal.

Note: Moving averages are based on past prices and are known as lagging indicators. This means that the information they are displaying to you has already happened. They can not predict when a trend reversal will happen, they can only confirm it once it has happened.

There are a few different types of moving average that we can use in our trading arsenal. The main two that we will consider in this course are the simple moving average (SMA) and the exponential moving average (EMA). Let’s break each one down in more detail.

Simple moving average

Let’s say that we are using a 5-day SMA for our chart. This means that our moving average line will represent the average closing price of the previous five days.

For example, if the closing price over the last 5 days were $1.63, $1.65, $1.70, $1.67, $1.62 our calculation would look like this:

($1.63 + $1.65 + $1.70 + $1.67 + $1.62) / 5 = $1.65. So in this case, our 5-day SMA would be at $1.65.

The longer the period of time that the SMA covers, the less reactive it is to current price changes and fluctuations in the market.

As each of the price points has equal weighting, the most recent price action effects the market just the same as the last price point the SMA uses in its calculation.

This can be problematic to traders as it means that the SMA is slower to react to rapid price movements that may prove to be important.

Exponential moving average

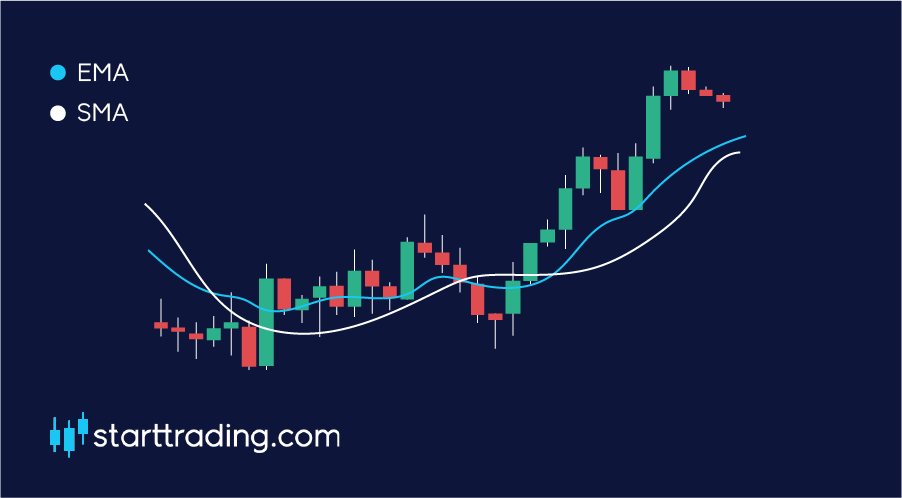
This is where the exponential moving average (EMA) comes in. The EMA gives more weight to the recent price movements which in turn makes it more reactive to the recent events in the market.

This can be beneficial to a lot of traders as trend reversals can be spotted more quickly as the more reactive EMA will display shifts in sentiment over the SMA.

Due to this, when you look at a chart with both the SMA and EMA visible at the same time, you can see that the EMA is closer to the actual price and is more volatile than its counterpart.

When trading, it is much more important to be able to visualise what is going on right NOW with the price action rather than what was happening in the market previously.

Length of the moving average

The period of time that the moving average covers will make a significant difference to its position on each chart. That’s why most traders utilise multiple MA’s at the same time. Here are some of the most commonly used:

10-20 – Short term trends

50 – Mid  term trends

200 – Long term trends

How to trade with moving averages

Moving averages act a lot like support and resistance lines. As many traders are using them at the same time, they are often met with a reaction when the price nears these points. Keep this in mind when doing your analysis.

Look for a bounce or a breakout of these points and then enter your positions accordingly.

As a rule of thumb, when the price is below the MA it will act as resistance for the price to break through. Conversely, when the price is above the MA it will act as a support.


Because of this, when the price has successfully crossed up and over the moving average line, this would be considered to be a buy signal.

On the flip side, when the price crossed the moving average line to the downside then this would be considered a sell signal.

Next Steps

To conclude starttrading.com make learning to trade easier, you don’t have to start trading alone. Take your trading to the right level, simply sign up to our FREE online trading course so that we can give you the help you need today!

Share:

Share on facebook
Share on twitter
Share on linkedin
Share on whatsapp

What is a trading plan

What is a trading plan?

Having a suitable trading plan is one of the most important aspects of trading. It’s there to act as your own personal decision-making tool, helping you answer vital questions like what, when, why and how much to trade. Your plan should cover your personality, attitude to risk, trading goals, risk management rules and any trading strategies you intend to follow.

Share:

Share on facebook
Share on twitter
Share on linkedin
Share on whatsapp

It is vital for your trading plan to be personal to you. It’s no good copying someone else’s plan, because that person will very likely have different goals, attitudes and ideas to you. They will also almost certainly have a different amount of time and money to dedicate to trading.

What’s the difference between a trading strategy, a trading plan and a trading diary?

You’ll hear these terms used a lot in the industry, often interchangeably, but for the purposes of this course we’ll be talking about specific things when we refer to them:

  • A trading strategy defines precisely how you should enter and exit trades. For example, ‘Buy gold when it drops below $1250, sell when it reaches $1350’ would be a very simple trading strategy.
  • A trading plan is a comprehensive blueprint covering everything from your goals, motivation and attitude to risk, through to risk management rules and analysis of past trades. It can (and should) include both your strategies and your commitment to keeping a diary.
  • A trading diary is a written record of everything that happens when you trade, including entry and exit points, profit/loss, trading statistics and even your emotional state before, during and after each trade.

Why is a trading plan important?

A trading plan is your own personal decision-making tool, helping you answer questions like what, when, why and how much to trade. It should provide a blueprint of how to trade in any given situation, which:

    1. Makes trading easier
    2. Helps you trade without emotion
    3. Helps you to maintain discipline
    4. Enables you to improve

It makes trading easier:

A trading plan gives you guidance on when and how you should trade. Without a plan you might be constantly worrying about which market to trade, whether to take your profits early, let your losses run, or if you’re missing out on other opportunities in different markets. With a trading plan you’ve done all the thinking upfront, so you can wait for the right market conditions and trade according the parameters you’ve set for yourself.

It helps you trade without emotion:

A plan can remove emotional decision-making in the heat of the moment. You should already know your desired profit, and acceptable loss, on every trade before you place it. This means you’ll be able to cope with any dramatic changes in the market price as your trade is in progress. Realistically, markets can only go up or down, so you should be able to plan for every eventuality beforehand.

It helps you to maintain discipline:

Discipline is an extremely important trait for a trader. Anyone can get lucky on a few trades, but a disciplined trader is much more likely to be profitable in the long run. And if you have a solid trading plan, discipline is much easier to maintain.

Say you start using a simple trading strategy – for example, you go long on the S&P 500 every time it goes up more than 0.5% in one day, with the expectation it will continue to rise.

However, after a couple of trades your strategy doesn’t seem to be working very well and you’ve lost some money. Do you abandon it immediately?

Depending on your circumstances, you might decide to stick with it. You can then find out if there’s a fundamental flaw with the strategy, or if you were just unlucky with the first few trades.

If it’s the former, is there a way you can tweak the strategy based on the results of your trades? By maintaining discipline and sticking to your plan, you could potentially turn a losing strategy into a winning one – or at least discover how and why it wasn’t successful.

It enables you to improve:

By following a trading plan, and maintaining a trading diary, you can keep a record of what works for you and what doesn’t. This is useful for analysing your own performance and improving as a trader. A full record of every trade makes it much easier to learn from your mistakes, and to evaluate which trades you won (or lost) by luck or by judgment.

Share:

Share on facebook
Share on twitter
Share on linkedin
Share on whatsapp

Understanding take-profit

What is a take profit order?

A take profit order is an order that closes your trade once it reaches a certain level of profit. When your take profit order is hit on a trade, the trade is closed at the current market value. 

Share:

Share on facebook
Share on twitter
Share on linkedin
Share on whatsapp

What is profit-taking?

A take-profit order (T/P) is a type of limit order that specifies the exact price at which to close out an open position for a profit. This allows a trader to apply risk management in an automated and consistent way based on any trading strategy.

Take-profit basics

Most traders use take-profit orders in conjunction with stop-loss orders (S/L) to manage their open positions. If a trade approaches the take-profit point, the T/P order is executed and the position is closed, securing any profits. If the security falls to the stop-loss point, the S/L order is executed and the position is closed for a loss.

Take-profit orders are best used by short-term traders interested in managing their risk. This is because they can get out of a trade as soon as their planned profit target is reached and not risk a possible future downturn in the market. Traders with a long-term strategy do not favor such orders because it limits their potential profits.

The benefit of using a take-profit order is that the trader doesn’t have to worry about manually closing a trade or second-guessing themselves. This lowers the possibility of human error and emotions such as greed getting the better of you, such as leaving a winning trade that has already reached your target open just to try to make more money.

Note – When you have take-profit and stop-loss orders in place is the only time you can leave a trade overnight.

Take-profit orders are often placed at levels that are defined by other forms of technical analysis, including chart pattern analysis and support and resistance levels.

How to use a take-profit like a professional trader

A take profit order is often used simultaneously with a stop-loss, which helps define your risk to reward ratio. Risk to reward and appropriate trade sizes are essential in determining how successful you are in the markets. Therefore, a take profit order allows you to limit your risk or exposure to the market by exiting your trade as soon as the an opportunity presents itself and not staying in any longer than anticipated.

Should you use a take-profit order?

Whilst every trader is different in terms of trading strategy, risk profile and the time they stay in a trade. There are a few key questions you can ask to determine whether or not you should use a take profit order.

First, if you are a long-term/ swing trader, you are likely looking to take advantage of longer-term trends. Swing-traders who use take profit targets are often frustrated when they’ve recognized a good trend and get out very early and miss out on missed potential profits.

While the market is ranging, take profit orders are often preferred. It is because resistance levels often hold back price advances and support levels often hold up price drops. Therefore, if you are buying low in price moves up to resistance in a range-bound market, a take profit order at an elevated price is desirable before the market retraces closer to or below your entry point.

Pros and cons of take-profits

There are several benefits to trading with a profit target, some of which were briefly addressed above. However, there are also some drawbacks to using them.

The positive aspects of using take-profit include:

  • By placing a stop-loss and a take-profit, the risk/reward of the trade is known before the trade is even placed. You will the best and worse can scenario, and based on that information you can decide if you want to take the trade.
  • Profit targets, if based on rational and unbiased analysis, can help eliminate some of the emotion in trading since the trader knows that their profit target is set and in a good place based on the chart they are analyzing.
  • If the profit target is reached, the trader capitalized on the move they forecasted and will have a reasonable profit on the trade. Assuming the trader was happy with the risk/reward of the trade prior to taking it, they should be happy with the result regardless of whether they win or lose. In either case, they took the trade because there was more upside potential than downside risk.

There are some potentially negative aspects of using take-profit as well:

  • Placing profit targets requires skill; they should not be randomly placed based on hope or fear. Remember the importance of not trading with emotions.
  • Take-profit targets may not be reached. The price may move toward the profit target but then reverse course, hitting the stop-loss instead. It can even reach 1 pip away before reversing. As mentioned, placing profit targets requires skill. If profit targets are routinely placed too far away, then you likely won’t win many trades. If they are placed too close, you won’t be well compensated for the risk you are taking.
  • Take-profit targets may be greatly exceeded. When a profit target is placed, further profit (beyond the profit target price) is forfeited. If you place a trade at $7.50 and place a take-profit order $7.75, you give up any profits above $7.75. Remember though, you can always get back in and take another trade if the price continues to move in the direction you expect.

Day traders should always know why and how and they will get out of a trade before they enter. Whether a trader uses a take-profit to do this is a personal choice.

Conclusion

There are multiple ways a trader can exit a trade with a profit. Using a take-profit is the most consistent way to do this automatically, removing any human error or emotional attachment to a. trade. When you use a take-profit you are estimating how far the price will move and assuring that you will close realise your profits when that trade reaches your limits, instead of gambling on additional profits.

When you calculate your take-profits and stop-loss to ensure that the rewards outway your risk before you place the trade, you will know your best and your worst-case scenario. Which will close automatically with either a profit or a loss.

Share:

Share on facebook
Share on twitter
Share on linkedin
Share on whatsapp

What are the best currency pairs to trade?

What are the best currency pairs to trade?

Name a market that never closes during the working week, has the largest volume of the world’s business, with people from all countries of the world participating every day. Yes, you guessed right – the Foreign Exchange Market (Forex). 

Share:

Share on facebook
Share on twitter
Share on linkedin
Share on whatsapp

The Forex market has arisen from the need for a system to facilitate the exchange of different currencies from around the world in order to trade. It is the premier financial market in the world, which reflects the financial dynamics of world trade quite clearly.

The famous phrase ‘money never sleeps’ – coined by the well-known Hollywood movie ‘Wall Street’ – sums up the foreign currency exchange market perfectly. No matter what time of day it is, the Forex market will stay open from 5pm EST on Sundays until 4pm EST on Fridays, every week, 24 hours a day during trading days!

When you begin to trade Forex online, you may find yourself overwhelmed and confused by the sheer number of currency pairs available through the MetaTrader 4 trading terminal. What are the best currency pairs to trade? The answer isn’t straightforward, as it varies with each trader. You need to take the time to analyse different pairs against your own strategy, to determine which are the best Forex pairs to trade on your own account.

This article will briefly describe what currency pairs are, and will assist you with identifying the best Forex pairs to trade. It will also explain what Forex majors are and whether they will work for you.

What are currency pairs?

Forex trading – or foreign exchange trading – is all about buying and selling currencies in pairs. For the buying and selling of currencies, you need to have information about how much the currencies in the pair are worth in relation to each other. This relationship is what defines a currency pair. A currency pair quotes two currency abbreviations, followed by the value of the base currency, which is based on the currency counter.

There is always an international code that specifies the setup of currency pairs. For example, a quote of EURUSD 1.23 means that one Euro is worth $1.23. Here, the base currency is the Euro (EUR), and the counter currency is the US dollar. Thus, each currency pair is listed in most currency markets worldwide. If you would like to learn more about Forex quotes, why not check out our article which explores the topic in greater detail?

Are majors really the best currency pairs to trade?

Not surprisingly, the most dominant and strongest currency, as well as the most widely traded, is the US dollar. The reason for this is simply the sheer size of the US economy, which is the world’s largest. The US dollar is the preferred reference in most currency exchange transactions worldwide. It is the dominant reserve currency of the world.

The following currency pairs (listed below) are not necessarily the best Forex pairs to trade, but they are the ones that have high liquidity, and which occupy the most foreign exchange transactions:

  • EUR/USD (Euro – US Dollar)
  • USD/JPY (US dollar – Japanese Yen)
  • GBP/USD (British Pound – US Dollar)
  • AUD/USD (Australian Dollar – US Dollar)
  • USD/CHF (US Dollar – Swiss Franc)
  • USD/CAD (US Dollar – Canadian Dollar)

The values of these major currencies keep fluctuating according to each other, as trade volumes between the two countries change every minute. These pairs are naturally associated with countries that have greater financial power, and the countries with a high volume of trade conducted worldwide. Generally, such pairs are the most volatile ones, meaning that the price fluctuations that occur during the day can be the largest.

Does this mean that they are the best? Not necessarily, as traders can either lose, or make money on the fluctuations. The aforementioned pairs tend to have the best trading conditions, as their spreads tend to be lower, yet this doesn’t mean that the majors are the best Forex trading pairs.

What is the best currency pair to trade?

With over 200 countries in the world, you can find a handful of currency pairs to engage with trading. However, these currency pairs may not have the potential to deliver the best results to traders. So what is the best currency pair to trade? What do most traders trade? What currency pair is worth trading and why? Keep on reading this article to find out the answers to these questions and more!

Before analysing the best currency trading pairs, it is better to enhance our knowledge on the most popular currencies that can be found in the world of Forex trading. They include:

  • US Dollar (USD)
  • Euro (EUR)
  • Australian Dollar (AUD)
  • Swiss Franc (CHF)
  • Canadian Dollar (CAD)
  • Japanese Yen (JPY)
  • British Pound (GBP)

Out of these currencies you can find a few popular currency pairs. If you want to achieve success in Forex trading, you need to have a better understanding of the currency pairs that you trade. If you select any of the currency pairs we’re going to discuss below, you will make trading much simpler for yourself, as lots of expert analytical advice and data is available on them.

Analysis of the best currency pairs to trade

Let’s take a detailed look at the currency pairs below:

  • USD/EUR – This can be considered the most popular currency pair. In addition, it has the lowest spread among modern world Forex brokers. This currency pair is associated with basic technical analysis. The best thing about this currency pair is that it is not too volatile. If you are not in a position to take any risks, you can think of selecting this as your best Forex pair to trade, without it causing you too much doubt in your mind. You can also find a lot of information on this currency pair, which can help prevent you from making rookie mistakes.
  • USD/GBP – Profitable pips and possible large jumps have contributed a lot towards the popularity of this currency pair. However, you need to keep in mind that higher profits come along with a greater risk. This is a currency pair that can be grouped into the volatile currency category. However, many traders prefer to select this as their best currency pair to trade, since they are able to find plenty of market analysis information online.
  • USD/JPY – This is another popular currency pair that can be seen regularly in the world of Forex trading. It is associated with low spreads, and you can usually follow a smooth trend in comparison with other currency pairs. It also has the potential to deliver exciting, profitable opportunities for traders.

All the major currency pairs that can be found in the modern world are equipped with tight spreads. However, this fact is not applicable to the USD/GBP currency pair, because of its volatility. It is perhaps better to avoid the currency pairs that have high spreads. The recommended spread by the trading experts tends to be around 0-3 pips. When it exceeds 6 pips, the trading pair may become too expensive, which can lead towards greater losses.

Still, it doesn’t mean that you should totally avoid everything that has high spreads. The best way to trade sensibly and effectively in this regard would be to exercise risk management within your trading, so you can effectively manage the risks.

Exotic currency pairs

Typically the best pair for you is the one that you are most knowledgeable about. It can be extremely useful for you to trade the currency from your own country, if it is not included in the majors, of course. This is only true if your local currency has some nice volatility too. In general, knowing your country’s political and economical issues results in additional knowledge which you can base your trades on.

You can find such information through economic announcements in our Forex calendar, which also lists predictions and forecasts concerning these announcements. It is also recommended to consider trading the pairs that contain your local currency (also known as ‘exotic pairs’). In most cases, your local currency pair will be quoted against USD, so you would need to stay informed about this currency as well.

Conclusion

The dynamics of foreign exchange trading is an interesting subject to study, since it can provide a boost to the world economy, along with the rise and fall of its financial fortunes. As globalisation becomes a bigger, more pressing issue for most countries around the world, the fate of these pairs is closely interconnected. Make sure you study the foreign exchange market extensively before making an investment.

There are many Forex pairs available for trading and it is highly recommended to try trading most of them before you choose a particular one to stick with. As Forex trading is risky, try it first on a Demo account with a virtual balance, which contains virtual funds of $10,000. Identifying the best currency pair to trade is not easy. The best way to accomplish this is through hands-on experience. Simply open a Demo account, and start trading on the live markets when you are ready, and you will be well on your way to success in the Forex markets!

Share:

Share on facebook
Share on twitter
Share on linkedin
Share on whatsapp

What is CFD trading?

What is CFD trading?

CFD trading is the buying and selling of CFDs, contracts for difference. CFDs are a derivative product because they enable you to speculate on financial markets such as shares, forex, indices and commodities without having to take ownership of the underlying assets.

Share:

Share on facebook
Share on twitter
Share on linkedin
Share on whatsapp

What is a CFD?

A CFD, or Contract for Difference, is a derivative product that traders can use to speculate on the future direction of a market’s price. You’ll never take ownership of the underlying asset, which means you can take advantage of rising and falling markets. CFDs can be traded on a wide range of over 4000 global markets.

CFD trading explained

Put simply, CFD trading lets you speculate on the price movement of a variety of financial markets such as currencies, stocks, commodities and bonds, regardless of whether prices are rising or falling. Because you are speculating on price movement rather than owning the underlying instrument, you will not pay UK Stamp Duty on any profits.

How does CFD trading work?

When you open a CFD position you select the amount of CFDs you would like to trade and your profit will rise in line with each point the market moves in your favour.

If you think the price of your chosen market will go up, you click buy and your profits will rise in line with any increase in that price.

However, if the price falls, then you will make a loss for every point it moves against you.

For example, if you think the price of oil is going to go up then you could place a buy trade of 5 CFDs at the price of 5325. If the market rose 30 points to 5355 and you closed out your position, you would make a $150 profit, 30 times the 5 contracts that you bought.

However, if the market moves against you and the price of oil falls 30 points to 5295 then you would lose $150.

Why is CFD trading popular with investors?

CFDs are a popular way for investors to actively trade financial markets. This is because CFDs are:

  • Tax efficient: You are not required to pay UK Stamp Duty
  • Flexible – you can trade on rising as well as falling markets: Trade on falling markets (going short) as well as rising markets (going long)
  • Leveraged products: Use a small amount of money to control a much larger value position
  • Hedging tools: You can use CFDs to offset any potential loss in value of your physical investments by going short

Trading on falling markets

If you believe a market will fall in value, you can sell a market – known as going short – and make a potential profit from falling prices. This is different from traditional Share dealing where you can only buy, or go long.

Example

The US 500 is trading at 2340. You believe the US 500 will fall as you expect the forthcoming US earning season to disappoint.

You open a sell position of 5 US 500 CFDs at 2340.

The US 500 falls by 65 points to 2275 and you decide to close your trade.

Hedging

As CFDs allow you to short sell and therefore make a potential profit from falling market prices, they can be used as a tool by investors as ‘insurance’ to offset losses made in their physical portfolios.

For example, if you hold £5,000 of Barclays shares and you concerned that they are due for an imminent sell-off, you can help protect your share portfolio by short selling £5,000 of Barclays CFDs.

Should Barclays share prices fall by 5% in the underlying market, the loss in value of your share portfolio would be offset by a gain in your short sell CFD trade. In this way, you can protect yourself without going through the expense and inconvenience of liquidating your stock holdings.

CFD trading is a margined product

This means you trade by paying just a small fraction of the total value of the contract.

Remember that with leveraged trading, there is a potential for your losses to exceed deposits.

In other words you can put up a small amount of money to control a much larger amount potentially magnifying your return on investment. Remember, however, that your losses will be magnified as well, so you should manage your risk accordingly.

Which CFD markets can I trade on?

Most brokers offer a choice of over 4,000 CFD markets, including:

  • Indices such as the UK 100, Wall St and Germany 30
  • FX such as GBP/USD, GBP/EUR and JPY/USD currency pairs
  • Shares such as Rio Tinto, Amazon and General Electric
  • Commodities such as oil, gold and cocoa
  • Other markets including bonds, interest rates and options

Is CFD trading right for me?

CFD trading is ideal for investors who want the opportunity to try and make a better return for their money.

However, it contains significant risks to your money and is not suitable for everyone. We strongly suggest trading on a demo account before you try it with your own money.

CFD trading may be ideal for people:

  • Looking for short term opportunities: CFDs are typically held open for a few days or weeks, rather than over the longer term
  • Who want to make their own decisions on what to invest in: It is not advised to allow anyone to trade for you or trade on your behalf. 
  • Looking to diversify their portfolio: Most brokers offer over 4,000 global markets to trade on including shares, commodities, FX and indices
  • Be as active or passive as they want: You can trade as little or as often as you want

For more insight in understanding, trading and investing, enrol in our free online trading course, which will help guide you through your journey to become a successful trader.

Share:

Share on facebook
Share on twitter
Share on linkedin
Share on whatsapp